This is the first article in a series I’ll be dedicating to bottlenecks in AI and Robotics. The idea is simple: rather than chasing the next trendy name, I prefer to identify the mandatory choke points of the entire AI chain — the places where demand can’t route around supply. This is the “multibagger” sleeve of my portfolio — conviction bets on mechanics I understand, not lottery tickets.
The first in the series is about memory, with company proposals tied to this trade. It builds on elements already present in my portfolio, based on supply/demand asymmetries — the same logic as in my article on Strategy Inc. (MSTR): an asset whose supply is constrained, a demand that can’t route around it, and a price that eventually stops drifting and snaps instead.
This article is structured in seven parts: first the building blocks of memory, to lay down the vocabulary; then the Nvidia supercycle pattern, transposed to memory; the state of the market today; the companies where to play this thesis; the central debate over whether the cycle is over; valuation; and finally sizing. Each part builds on the previous one.
The Short Version
Supply and demand indicators say the memory cycle isn’t over. But Micron’s and SanDisk’s prices already behave as if the peak had passed. Today, Micron trades around $948.80, down more than 24% from its mid-June high of $1,255. SanDisk trades around $1,727.18, down nearly 27% from its 52-week high of $2,354, with a good chunk of that lost in just a few sessions. Both stocks remain extremely volatile day to day — these levels will move fast, and that’s not the point.
The point: it’s this gap between price and fundamentals that interests me — reinforced by an almost mechanical effect: with gross margins of 78-85%, as long as prices hold, every extra dollar of revenue falls almost entirely to the bottom line.
The building blocks of memory: what it’s for, and why AI can’t do without it
Before going further, the definitions need to be laid out. Memory isn’t a single block — it’s several families of products, each playing a different role in an AI machine. The most useful distinction to keep in mind is between volatile memory (which loses its content without power) and non-volatile memory (which retains its data).
The premise of this section: being able to understand the mechanics at play in broad strokes, with even a very limited technical interest. Judging the precise relative value between products requires being a specialist in the field — that’s not what’s being asked here. The goal is to understand enough vocabulary to follow the rest of the article, not to become a memory engineer.
Volatile memory
Dynamic RAM (DRAM) is fast, volatile memory: it loses all of its content the moment power is cut. It’s the working memory used by data centers, PCs, mobile devices, and cars. It comes in several flavors depending on use: DDR5 is the workhorse of standard servers and PCs; LPDDR is the low-power variant that powers every smartphone, and increasingly AI servers where energy efficiency matters at rack scale; GDDR is the graphics variant, soldered next to GPUs in gaming cards and certain inference accelerators.
HBM (High-Bandwidth Memory) is the flagship DRAM product for AI: a 3D-stacked architecture, directly fused onto the processor. It’s the piece that answers the real problem of AI compute: a GPU starved of data to process is the most expensive and most useless machine in the data center. Compute is worthless if memory can’t feed the processor fast enough — that’s exactly HBM’s job. It’s also why only three companies in the world are capable of making it.
Non-volatile memory
NAND is rewritable non-volatile storage — the kind that keeps data even without power (SSDs, memory cards, USB drives). Historically, its role in AI was secondary to DRAM’s. That’s changing: recent inference architectures now rely on large NAND pools to offload the “KV-cache” (the context memory a model holds onto mid-generation) and store long context — a use case that barely existed a year ago and could, on its own, add substantial demand by 2027-2028.
NOR handles reliable code storage (system boot-up, embedded automotive/industrial applications) — a more minor segment, less central to this thesis.
HBF (High Bandwidth Flash) aims to combine flash density with DRAM-like bandwidth — co-developed by SanDisk and SK Hynix. Important point to keep in mind: it’s still at the design and prototype stage, not commercial production. None of this is in current revenue or in analyst models yet — it’s optionality, not a given.
One idea to take away from this section: memory isn’t a simple accessory to AI compute, it’s what decides whether compute can actually run at full capacity. That’s why it deserves its own place in a series on bottlenecks.
---
1. The Nvidia supercycle pattern
Three years ago, Nvidia followed a precise pattern. It wasn’t just “the stock went up.” It’s two engines running at the same time:
Earnings explode, because AI compute demand far exceeds what the industry can produce.
The multiple re-rates, because the market changes its reading grid: Nvidia is no longer a cyclical graphics card maker, it has become the mandatory infrastructure of an entire industry.
Two engines running together doesn’t produce an additive gain. It produces a squared gain: earnings ×, multiple × —> price ײ.
The trigger for the re-rating is never the product itself. It’s the change in status: from a commodity you buy at the best price, to a strategic asset whose access you secure at almost any reasonable price. That’s the status shift that has to be spotted before it gets priced.
I think we’re watching exactly this pattern replay in memory, with a two-to-three-year lag on Nvidia.
---
2. The state of the memory market today
Memory has become AI’s new wall. The “memory tax” — memory’s share of AI capex — now represents roughly a third of the total, and that share is growing.
What’s really changed is long-term contracts (LTAs / NBMs depending on the company). Historically, memory sold like any commodity: produce, stockpile, sell on a spot market and short contracts that adjusted violently. LTAs change the mechanics: multi-year agreements, prepayments, committed volumes, take-or-pay penalties. It increasingly looks like what a semiconductor foundry does — not what a commodity seller does.
The bulls’ argument: if memory pulls off the same business-model transition as foundries or hard drives after 2011, it deserves the same valuation transition.
One nuance worth keeping in mind: these contracts dampen cyclicality, they don’t eliminate it. A precedent exists and it stings: in 2017, similar commitments held exactly until they were tested by a real slowdown, then got renegotiated back toward spot prices within a few quarters.
The difference with 2017 is the demand engine. In 2017, the tension came from a classic smartphone/server upgrade cycle. Today, it’s generative AI that needs unprecedented compute power — and therefore memory — with multi-year investment budgets committed by players who historically never had to haggle over memory prices. This article rests on the hypothesis that this demand engine constitutes a genuine investment supercycle, not a classic cycle peak that will unwind at its usual pace. If that hypothesis is wrong, so is the rest of the thesis.
---
3. Segments and companies: where to play the thesis
In this supercycle, not everyone is exposed the same way. Two worlds need distinguishing: HBM, on the GPU side, serving model training at Nvidia — and “classic” high-capacity memory (DRAM, NAND, and tomorrow HBF), serving inference instead.
**Micron** is the American generalist pure player — DRAM and NAND, with a clear geopolitical positioning: it’s the only one of the three big memory players that answers to the United States, with CHIPS Act-backed fabs in Idaho, New York, and Virginia. Strategic contracts signed with hyperscalers, HBM capacity sold out in advance.
**SanDisk** is the NAND/flash pure-play. It’s developing HBF, co-developed with... SK Hynix — still at the prototype stage, as noted above. But the nuance needs to stay clear: SanDisk does one thing, flash, while SK Hynix remains structurally focused on HBM for Nvidia GPUs — on the training side, not the inference-memory side that’s the core of this thesis.
**Samsung** is deliberately not covered in detail here. It’s a generalist conglomerate — memory, foundry, consumer electronics — whose memory exposure is too diluted within a much larger empire to make it a pure vehicle for this specific narrative.
One nuance not to forget: flash itself isn’t fully sheltered. HBM, CXL-attached memory, and new non-volatile architectures could eventually shrink flash’s role in AI pipelines. SanDisk is developing HBF precisely to stay ahead of that risk — but incumbents historically don’t always see disruption coming in time.
---
4. The central debate: is the memory cycle over?
This is the question that decides everything else. And the answer doesn’t depend on opinion — it depends on two things that can be observed: supply/demand fit, and price as the normalization gauge for the shortage.
**The bear camp** says: capacity is coming. New fabs and production lines are set to come online starting 2027-2028. Historically, every memory margin peak has eventually attracted the capacity that floods the market and breaks prices. The classic mechanism, once the shortage clears: prices normalize, earnings normalize along with them, and the market doesn’t discover it all at once — the P/E drifts down slowly ahead of time, as investors anticipate the end of the cycle before it even shows up in the results. 2028 is when the music stops.
**The bull camp** answers with arithmetic rather than pattern-matching: bit demand is growing in the mid-20s percent per year. The HBM conversion ratio (it takes roughly three commodity wafers to produce the bit-equivalent of one HBM wafer) means the current capex wave isn’t excessive — it’s the bare minimum required to keep the shortage from becoming absurd.
My read: the real test arrives in 2028. I don’t calculate beyond that date — as they say in chess, long variation, bad variation. If a thesis needs a chain of assumptions stretching indefinitely into the future to hold up, that’s a sign it’s already fragile. Before 2028, the thesis of supply ruining the market has no physical grip. After that date, anything is possible, and I’d rather reassess the position at that point than pretend I can calculate it today. This is a position with a limited shelf life, not a conviction held forever.
Metrics to watch ahead of earnings
The problem with this debate is the temptation to wait for the next quarter to find out who’s right. Mistake: the market gives signals beforehand, provided you look in the right place.
Signal #1, The spot/contract spread
Memory sells on two parallel markets. The contract is where most of the volume gets negotiated — quarterly, between manufacturers and large buyers. That’s the price that actually generates companies’ revenue. Spot is the marginal market — small volumes traded day-to-day between distributors and brokers. It represents only a fraction of bits sold, but it moves instantly with sentiment, while the contract adjusts with a lag.
In a shortage, spot trades at a premium above contract, and that premium pulls the contract up the following quarter. In oversupply, it’s the reverse: spot drops below contract, buyers wait, and the contract eventually falls too. The most honest turning-point signal is exactly this crossover — spot dropping back below contract while inventories build. That’s happened before every historical peak of the memory cycle.
Spot is easy to track: public indices, widely relayed by trade press, free in broad terms — tracking its trend over time is already enough as an early warning. Contract is less immediate — three ways to approach it:
Monthly assessments from industry pricing services, built from surveys of market participants.
The average selling price each manufacturer reports on earnings calls — an implicit contract price, calculated after the fact, so available only on a quarterly cadence.
The anchor price written into the LTAs themselves, referenced to a given quarterly average — revealed only when deal announcements are made.
Signal #2: competing capacity announcements
Fully public — press releases, earnings calls, trade press. This isn’t theoretical: it’s precisely this kind of announcement (Samsung and SK Hynix signaling plans to expand capacity) that triggered the recent correction across the entire memory sector. The real test isn’t the announcement itself, it’s whether it translates into actual volumes that loosen the supply/demand ratio.
Signal #3: the 2027-2028 production timeline.
Known through manufacturers’ guidance and investor presentations, updated every quarter. As long as these sites aren’t producing yet, the capacity announcement remains an anticipated signal, not a consumed fact.
The other signals worth tracking — wafer reallocation between HBM and commodity DRAM, actual renewal of LTA contracts, inventory levels at manufacturers — are useful for understanding the mechanism, but in practice, they only confirm on a quarterly cadence. Better to know that than to believe everything can be tracked continuously.
**This dashboard — spot/contract spread first — is what serves as the exit or position-reduction signal, not a fixed price target.** As long as these indicators don’t move, the gap between current pricing and physical fundamentals remains the core of the thesis.
---
5. Valuation scorecard: does the price already reflect an end of cycle?
The question isn’t “is it expensive or cheap” in the abstract. The question is: what cycle scenario does the current multiple imply, and does that scenario match what’s actually observed in the supply and demand data?
Micron trades at a single-digit multiple on next-twelve-months earnings, even as it just posted record results. A multiple that low on such elevated profits means one thing: the market is betting these profits won’t last, that this is a peak and not a new floor. Set against the data from part 4 — a shortage that structurally shouldn’t clear before 2028 — this pricing looks ahead of the facts.
SanDisk trades at a hefty premium on this year’s earnings, but that premium collapses sharply when looking at 2027, provided long-term contracts hold. This is a different setup from Micron’s: here, the market isn’t pricing pessimism about the length of the cycle, it’s pricing optimism about the duration of the contracts — with little room for error in case of disappointment.
Scorecard — Micron (MU), current price $948.80
The table below applies 50%/year revenue growth through 2028 (a quite conservative assumption IMO) across all three scenarios — only net margin varies, between a cycle trough (10%), mid-cycle (30%), and a hold near the current peak (60%). Each cell gives the implied price, the change versus the current price, and the 2-year CAGR.
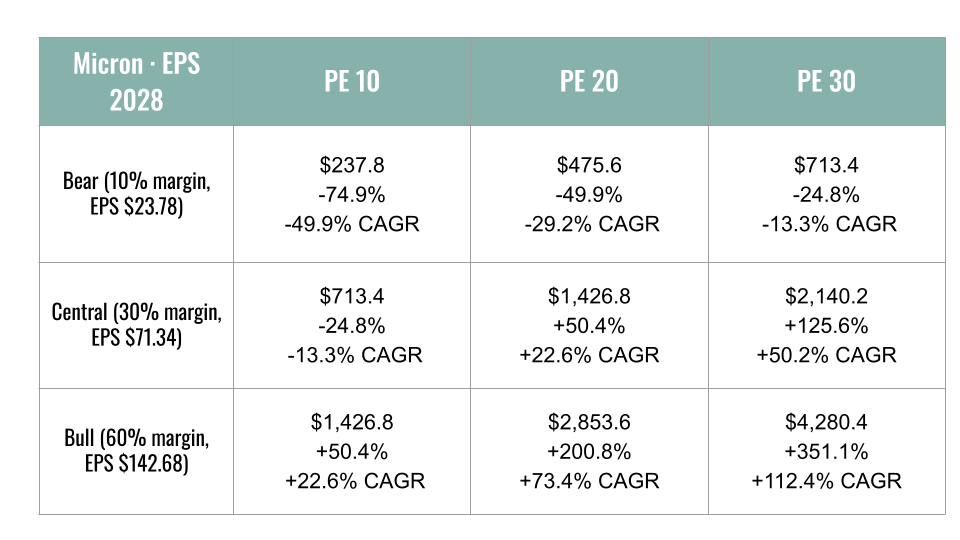
How to read this: the current price already sits between Central/PE 10 and Central/PE 20. In other words, it takes neither a Bull scenario nor a generous P/E to justify today’s price — a simple hold at mid-cycle with a modestly re-rated multiple is enough. Only the Bear scenario, at any P/E, is clearly a loss. That’s a favorable risk setup: the current price doesn’t require believing in the best-case scenario to be breakeven.
Scorecard — SanDisk (SNDK), current price $1,727.18
Same growth (50%/year) and margin (10/30/60%) assumptions as for Micron, to make the comparison direct.
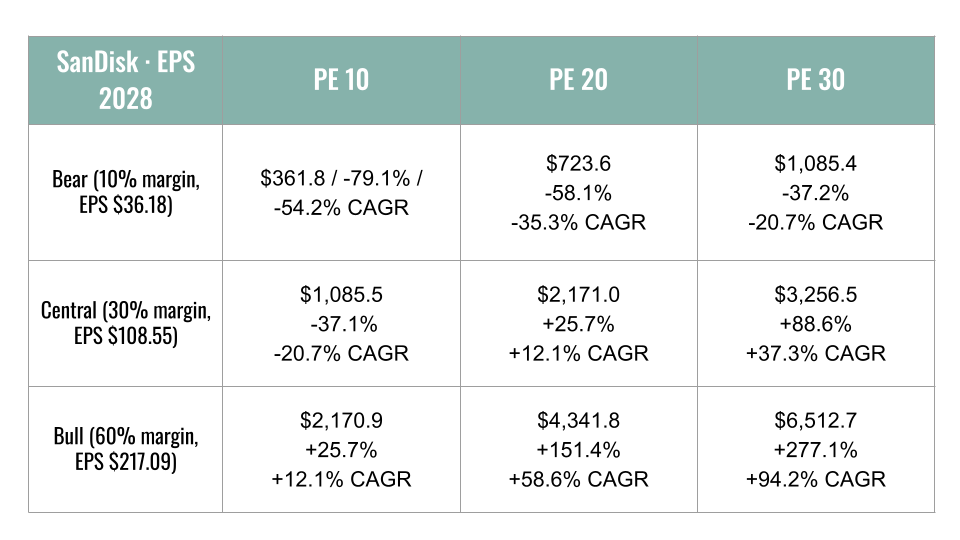
How to read this: here, the current price sits between Central/PE 20 and Central/PE 30 — it already takes a rich P/E applied to a mid-cycle scenario to be breakeven, and the Bear scenario stays a loss at any P/E in this table. That’s a less favorable risk setup than Micron’s: the current price leaves much less room for error before flipping into a loss.
The point linking both tables: at the 2027-2028 horizon, it’s the same parameter — the margin assumed — that decides everything, far more than the P/E applied. But the asymmetry between the two stocks is clear once the assumptions are harmonized: Micron needs fewer things to go right, SanDisk needs more things to go right just to avoid going wrong.
The argument that makes this bet interesting despite the uncertainty: the fixed-cost structure of the memory industry means that, as long as prices stay elevated, a revenue increase converts almost entirely into a net income increase, with current gross margins of 78-85%. It’s this mechanical gap — not a market opinion — that justifies taking the bet. The risk is symmetric: that same leverage works in reverse if prices turn.
My conviction: I’m not going in for now. I’m waiting for a price pullback, ideally through a genuine sector-wide sell-off, before entering — see part 6. That pullback might never come and I might miss the move. Fine by me: in that case I’d rather focus on other bottlenecks in the series, earlier in their own re-rating cycle.
6. Sizing
I plan to allocate between 5% and 10% of my portfolio to the full set of ‘bottleneck’ stocks in this series, across upcoming articles — not all at once, and not on a single name.
For Micron and SanDisk specifically, I’m passing for now. Both scorecards in part 5 show a real thesis, but both stocks have already rallied hard from their recent lows, and I’d rather wait for a genuine price pullback before entering. By “pullback,” I mean a temporary price panic — a sentiment purge like the one already documented in part 4 (sector rotation, scary capacity announcements, profit-taking after an extreme rally) — not a signal that the cycle is genuinely over. It’s precisely because nothing in the fundamentals changed during those episodes that a price plunge becomes an entry opportunity, not a reason to run.
That pullback might never come and the price might keep climbing without me. Fine by me. In that case I’d rather stay focused on other bottlenecks in the series, earlier in their own re-rating cycle, where the risk/price-paid ratio is more favorable today. Nothing stops me from coming back to Micron or SanDisk later if the price comes to me.
The dashboard from part 4 — spot/contract spread, capacity announcements, production timeline — remains the right filter for telling a genuine cycle turn apart from a simple sentiment purge, whether now or on a future entry attempt.
Conclusion
The same pattern that made Nvidia is replaying in memory, with a lag. Supply and demand data say the shortage holds at least through 2028. The price, meanwhile, already behaves as if it were all over — on Micron through pessimism about the length of the cycle, on SanDisk through a premium that leaves no room for error. Between the two, a simple mechanism: as long as prices hold, operating leverage makes earnings explode much faster than revenue. That’s the gap worth watching, with the dashboard from part 4 as the signal.
A new article is currently in the works on another bottleneck.
Sources
I have no formal obligation to disclose my sources, but I want to express that my articles are inspired by Ren’s articles and ideas, which I strongly recommend: https://substack.com/@renstocks
As well as Micron’s and SanDisk’s 10-Q and 10-K filings.
Important Disclosure & Disclaimer
All content published by JB Peter on this platform is strictly for educational and informational purposes. It does not constitute investment, financial, legal, or tax advice, nor does it represent a personal recommendation or solicitation to buy or sell securities. This research is operated by ORIACON (SASU) and reflects independent corporate analysis. Every reader must conduct their own independent research (Due Diligence) or consult a licensed professional before making any financial decision, as financial markets involve a high risk of capital loss. At the time of writing, ORIACON or the author DON’T HOLD shares in the company analyzed in this article. Following this publication, ORIACON and the author reserve the right to buy, sell, or modify positions in any security mentioned at any time, without prior notice to readers or subscribers