
Three years ago, Nvidia followed a precise pattern: two engines spinning together, not just one. Earnings explode because demand far outstrips available supply; the multiple re-rates in parallel, because the market changes its frame of reference — from a cyclical component maker to the mandatory infrastructure of an entire industry. Earnings ×, multiple × → price ײ.
Faced with a mismatch between supply and demand, the adjustment always happens through one of two levers: volume, or price. When available volume can’t keep up — because production capacity is structurally limited, or because it takes years to build — price is what absorbs the imbalance. It’s the same mechanism as oil when available quantities tighten, or any other supply squeeze: a rise in demand follows exactly the same logic as a drop in supply, the effect on price is identical. That’s the mechanism that drove up the price of memory in the previous article, and it’s the one we’re trying to spot here in the reducer and linear-motion space.
The trigger is never the product itself: it’s the change in status, from a commodity bought at the best price to a strategic asset whose access gets secured at almost any reasonable price. The question this article asks is where HDS and THK stand on that path — and the answer, as we’ll see, isn’t the same for both.
1. The short version
Two Japanese companies each carry the flag for their segment: Harmonic Drive Systems (HDS) for the reducer, THK for linear motion. My valuation view on both is simple to state, even though it’s hard to pin down precisely — there’s no consensus on which assumptions to use, and I’m setting some myself for lack of anything better: broadly, these companies are already too expensive in the absence of a bottleneck, and undervalued in the presence of one. As I am very bullish on the robotics and the probability of a bottleneck on these segments, I’m staring a position on HDS at 2% of my portfolio and 1% on THK.
2. Why I think there is a bottleneck in these segments
I came across a table from Goldman Sachs listing the possible bottleneck segments in humanoid robotics. I’ve reclassified it into three tiers below: real scarcity, real leverage but fragmented, or essential with no humanoid-specific alpha.
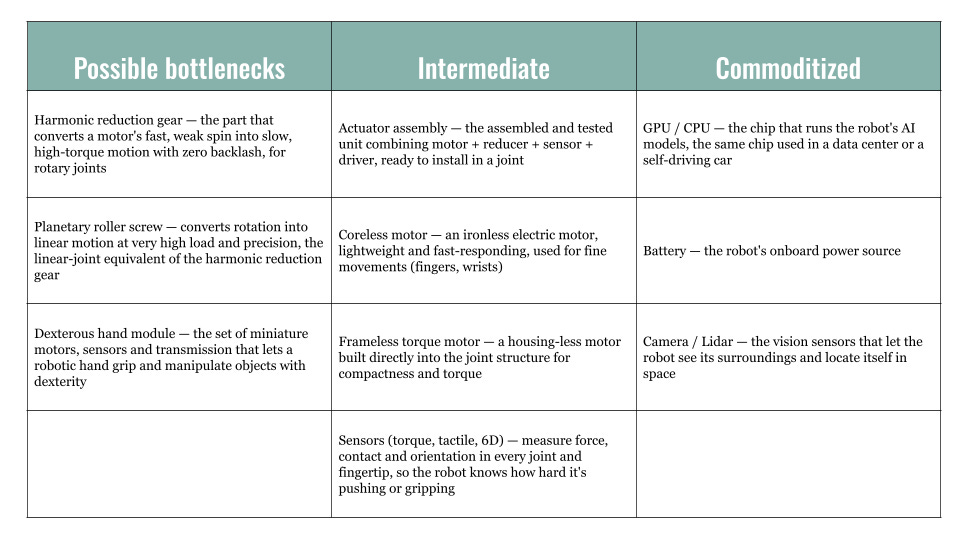
The ten categories from the Goldman table reclassified into three tiers: real scarcity, real but fragmented leverage, or essential with no humanoid-specific alpha.
Three items in the left-hand column deserve a fuller explanation, because the whole article rests on them.
The harmonic reduction gear is the part that converts a motor’s fast, weak rotation into slow, precise, high-torque motion — without the mechanical play (”backlash”) found in a conventional gear. In practice, a motor on its own spins far too fast and pushes far too weakly to move a robotic arm; the harmonic reducer does this conversion work inside the joint itself, in a compact housing. Its manufacture relies on a thin special-steel part (the “flexspline”) that flexes millions of times without fatiguing — a metallurgical know-how that’s hard to replicate quickly, which explains the scarcity of suppliers.
The planetary roller screw does the same job as the harmonic reducer, but for linear rather than rotary joints: it converts rotation into straight-line displacement, with load capacity and precision far superior to a standard ball screw. It’s the part typically found in the hips or knees of a humanoid robot, where you need to push hard in a straight line rather than pivot a joint.
The dexterous hand module brings together all the miniature motors, sensors and transmission mechanisms that let a robotic hand grip and manipulate objects with the finesse of a human hand. It’s a concentrate of every other component in the body (motors, reducers, sensors) miniaturized down to finger scale — which mechanically makes it the most complex and most expensive part of the robot.
3. The central debate: bull vs bear
The bear case common to both names
Price competition from China (for HDS) and from China/Taiwan via Hiwin (for THK) — an established fact for both companies, not a deduction.
Both stocks have already run up a lot: HDS is up nearly 3x in a year (roughly +200%), THK has doubled (roughly +100%, including +79% since the start of the year alone). Part of the margin of safety that existed a year ago has therefore already been consumed — entering today isn’t entering at the same price as whoever identified the thesis in 2025.
Strong cyclicality in both businesses, each dependent on semiconductor capex and industrial-automation cycles — not a guaranteed linear growth path.
The bull case common to both
A real demographic tailwind: the labor shortage is a structural driver of automation demand for both companies — not just a research-desk estimate.
Operational recovery already visible in recent numbers, not just in the narrative: HDS orders +16.2%, THK’s cost-to-sales ratio down 4.2 points in Q1 2026.
Real barriers to entry on both sides: long qualification cycles at robotics OEMs once a component is “designed-in,” and metallurgical know-how that’s hard to replicate quickly.
The fragmentation of the world into blocs: each bloc (Western, and within the West, the EU, the US and Japan taken separately) will want to keep strategic suppliers tied to its own bloc rather than depend entirely on an outside supplier. This isn’t just a price or volume argument: it’s a supply-security logic that structurally leaves room for a “trusted” bloc supplier — even at a higher price, even with less volume than the cheapest Chinese option. Both HDS and THK benefit from this mechanism, independent of their pure price competitiveness.
Momentum itself is a bull argument, not just a caution flag: the rally already realized in both stocks draws attention, flows, and media/analyst coverage, which tends to be self-reinforcing over the short and medium term. A stock that’s rallying hard attracts the next marginal buyer more easily than one that’s flat — that’s no guarantee of continuation, but it’s a genuine technical factor in favor of it continuing, to be weighed against the already-consumed margin of safety noted above.
Companies ruled out
a. China
LeaderDrive (Suzhou Green Harmonic, 688017.SH) is clearly a serious competitor to HDS on the harmonic reducer, at roughly half HDS’s product cost, and is gaining ground quickly (its share of Chinese robotics production has gone from near-zero in 2018 to over 30-35% in 2024-2025). I’m not investing in this segment for geographic reasons already laid out at the start of the series (Chinese A-shares, access, governance). That choice has a cost I’d rather name than stay silent about: it’s possible that price competition turns out to be tougher on the Chinese side than this thesis captures, if LeaderDrive and others keep gaining ground at the same pace.
b. Nabtesco
This is a company where the reducer (Component Solutions segment) accounts for only about a quarter of its revenue (~26% of FY2025 revenue, ¥307.9bn).
c. Schaeffler
A more classic case of diversification: the bulk of its revenue comes from automotive (bearings and transmission systems for combustion and electric vehicles), and its humanoid exposure is buried inside a much larger whole.
4. Harmonic Drive Systems
4.1 What the company does
HDS makes and sells precision reducers and mechatronic products, split into two families: harmonic reducers (77.8% of FY2026 revenue, ¥46.3bn, +9.5% YoY) — the “strain wave gearing” technology the company invented — and mechatronic products (22.2% of revenue, ¥13.2bn, -0.9% YoY), actuators integrating motor, reducer and sensors. Strong product concentration: 77.8% of revenue rests on a single line.
Customers: no names are broken out, and no single customer exceeds 10% of revenue in FY2026 (Nissan Motor, the only customer above 10% in FY2025 at ¥5.7bn, has fallen below that threshold) — good customer diversification. But end applications remain concentrated in three uses: industrial robots (the dominant application), semiconductor manufacturing equipment (growing fast, driven by generative AI and data centers), and automotive applications (declining) — solid customer diversification, more limited diversification by end use. The real end customers are industrial and collaborative robot OEMs (Fanuc, Yaskawa, ABB, KUKA, Universal Robots and Chinese manufacturers), semiconductor equipment makers, and medical/aerospace integrators — a “designed-in” component, very hard to substitute once built into a customer’s design.
Suppliers: no names identified. Gross margin depends heavily on the cost of raw materials (special steel alloys for the flexspline, which must withstand cyclical deformation without fatigue) and on labor — material and labor costs remain elevated, with an internal cost-reduction program underway.
Competitors: Nabtesco (the most significant, but positioned on RV reducers — a competing rather than directly substitutable technology, ~60% share of that sub-segment), and Sumitomo Drive Technologies. Harmonic Drive LLC (US) is not a competitor but HDS’s own local distribution/production subsidiary — not to be double-counted in the competitive analysis. The most significant competitor is actually Chinese: LeaderDrive (Suzhou Green Harmonic, 688017.SH), which produces at roughly half HDS’s unit cost and is gaining ground quickly — its share of Chinese robotics production has reportedly gone from near-zero in 2018 to over 30-35% in 2024-2025, alongside Beijing CTKM Harmonic Drive, Zhongda Leader and Zhenkang. It’s specifically this name, not a Western competitor, that represents the real competitive risk to the thesis — but it stays outside my investable universe (Chinese A-shares, per the geographic filter set out at the start of the series). In the overall precision-reducer market (RV plus harmonic combined), HDS remains a follower; on the harmonic reducer segment specifically, HDS is the category definer of its own technology, not the leader of the total market.
Moat: decades of patents and real-world reliability data, metallurgical know-how on the flexspline that’s hard to replicate quickly, and above all a high switching cost once the component is “designed-in” to a customer’s robotic arm architecture (1-2 year qualification cycles before series integration).
Balance sheet (gearing): gross financial debt of ¥13,219m against equity of ¥80,390m, a debt-to-equity ratio of 16.4% (22.5% including lease liabilities of ¥4,846m). Debt/EBITDA of roughly 1.3x (1.8x with leases) — comfortably manageable. HDS is in a net cash position (~¥6bn excluding leases).
Geographic revenue split (FY2026, by customer location): Japan ¥24,388m (41.0%), Europe ¥16,777m (28.2%, of which Germany alone 10.1%), North America ¥12,108m (20.3%, of which the US alone 18.0%), China ¥4,047m (6.8%), other regions (Korea, Taiwan, Oceania) ¥2,239m (3.8%). 59.1% of revenue is generated outside Japan — genuine geographic diversification, with a notable dependence on Germany within Europe. Like any company that exports the majority of its revenue, HDS remains mechanically sensitive to currency swings (USD/JPY, EUR/JPY): a weak yen mechanically inflates consolidated results in yen terms regardless of actual operating performance, and vice versa.
4.2 HDS valuation
The scorecard below crosses a flat 50%/year revenue growth assumption over four years (FY2026 → FY2030) with three net-margin scenarios (Bear 5%, Central 15%, Bull 30%), the same method as in the Memory article. Useful reference point: HDS’s current net margin is 2.7% (FY2026) — below the Bear scenario (5%) itself, which shows how far there is to go even to reach the bottom of the table.
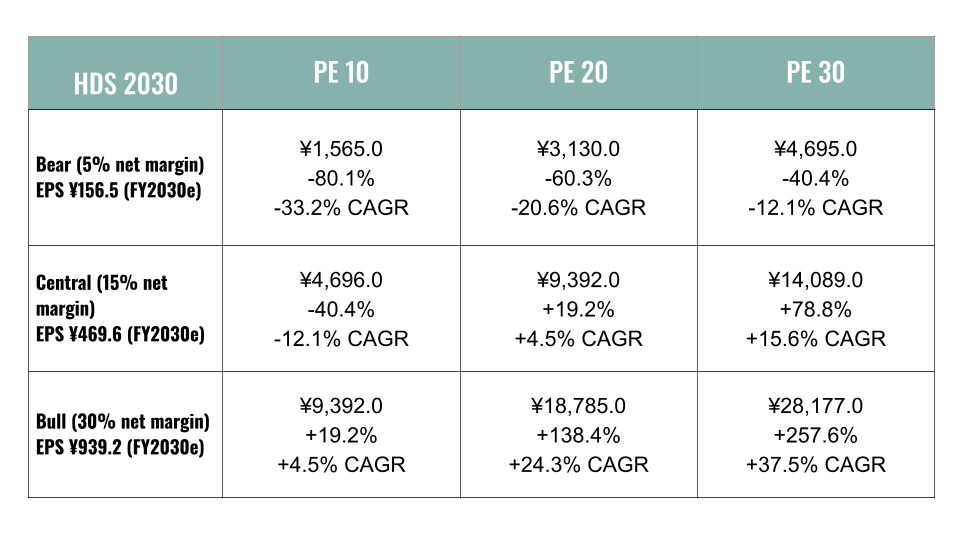
HDS is clearly too expensive in the absence of a bottleneck: under the Bear scenario (5% net margin, the scarcity thesis doesn’t pan out and Chinese competition captures pricing power), the stock is overvalued by 40-80% depending on the multiple used. It is, on the other hand, clearly a great price if the bottleneck is confirmed: under the Bull scenario (30% net margin, the harmonic reducer’s scarcity genuinely translates into pricing power), the stock is undervalued by 19% to 258%. The whole thesis comes down to that bet.
A word of context, so as not to dismiss the Bull scenario as unrealistic out of hand. In the Memory article, Micron and SanDisk genuinely saw a net-margin expansion of several dozen percentage points, driven by revenue growth well above 50% per year during the period when the memory bottleneck was biting — so the idea that a real bottleneck can produce this kind of trajectory isn’t a made-up scenario, it’s a verified precedent within this same series of articles. The asymmetry is therefore real. But Micron and SanDisk delivered that margin expansion with numbers already booked at the time of purchase, whereas HDS’s current guidance (FY2027 revenue barely +14.2%) is well short of a 50%/year pace. A bearish scenario therefore remains very much possible for HDS — the favorable asymmetry exists, but for now it’s only a possibility, not a precedent already confirmed on this stock.
4.3 Sizing
I’m keeping the series’ overall envelope: 5-10% of the total portfolio for all bottleneck bets combined, not on a single name, not all at once. I plan to add other companies in other bottleneck segments (optics, energy, power semiconductors in particular) in upcoming installments of the series — reallocation between names already in the portfolio and these newcomers can happen based on projections and how each one’s price-to-value ratio evolves, not on a fixed basis.
On Harmonic Drive Systems: I’m buying in, with 20% of the bottleneck sub-total allocation, i.e. 2% of the total portfolio. This isn’t a full position: the scorecard shows the current price only makes sense if the bottleneck is genuinely confirmed (Bull scenario), and stays frankly expensive otherwise (Bear scenario). The remaining allocation stays open for a top-up if the stock moves closer to the Bear/Central scenarios in the table, or if the China segment stabilizes over at least two consecutive quarters.
5. THK
5.1 What the company does
THK makes precision linear-motion components: the LM Guide (its founding product, invented in 1972), ball screws, linear actuators, cross roller rings, and seismic isolation/damping products as a diversification. Strong technological concentration: a single technology family (”rolling motion”) underlies the whole portfolio — a shock to that base technology would hit the entire group. Application diversification, on the other hand, is broad: machine tools, semiconductors, robotics, medical, aerospace. The automotive & transportation business (steering, suspension, and braking components) is being divested to AP87/Advantage Partners (closing expected June 1, 2026) and reclassified as a discontinued operation — the FY2026 figures (¥276bn of guided revenue) therefore cover only the continuing industrial business.
Customers: no customer named and no concentration data (top 10) available. Geographic and sector diversification mechanically limits dependence on any single customer, but this isn’t a verified figure, only a structural inference. Direct sales in Japan (plus agents) and through local subsidiaries in 5 regions (Japan, Americas, Europe, China, Other — with India/ASEAN expanding).
Suppliers: a diversified global supply base, not limited to Japan. No key supplier named. Likely critical inputs (special steel, bearing balls, precision grinding equipment) aren’t disclosed publicly — not a documented vulnerability point.
Competitors: NSK and IKO/Nippon Thompson (Japan), Bosch Rexroth and Schaeffler/INA (Germany), and above all Hiwin Technologies (Taiwan) — the low-cost competitor moving upmarket, particularly in China. No precise market share is available; as an unverified indicative point, THK and NSK are generally cited in trade press as the two largest global players in LM Guides.
Moat: precision-machining know-how built up over more than 50 years, historical patents on rolling technology, long OEM qualification cycles (a “designed-in” component, hard to dislodge once specified into a machine’s design), a global service and application-engineering network, economies of scale. Low-end competitive pressure is intensifying, driven by the rise of Chinese and other emerging-market products — real barriers, but not absolute ones, particularly against Hiwin and Chinese entrants.
Balance sheet (gearing): a debt-to-equity ratio of roughly 31% — noticeably higher than HDS’s (16.4%, 22.5% with leases), but still at a moderate level for an industrial company, no warning sign in itself. Consistent with other observations: short-term borrowings doubled in Q1 FY2026 (¥33bn → ¥60bn), partly to fund the buyback and the automotive divestiture; confirmed credit lines of ¥50bn are in place; cash stayed positive throughout the 2021-2025 cycle (¥120-160bn) and operating cash flow stayed positive even at the low point of the cycle (¥15.6bn in 2021). The point to watch is therefore not the absolute level of leverage, but its recent trajectory (short-term debt doubling in a single quarter) against a backdrop of already-generous shareholder returns (record dividend plus a completed buyback).
Geographic revenue split (FY2025, consolidated basis before the automotive reclassification): Japan ¥110.9bn (30%), Americas ¥90.2bn (25%), China ¥76.0bn (21%), Europe ¥67.5bn (18%), Other ¥21.6bn (6%) — a similar split in Q1 2026. Note that this breakdown covers the historical total business (automotive included); it isn’t directly comparable to the guided FY2026 revenue of ¥276bn, which excludes the divested automotive unit. Like HDS, THK remains mechanically sensitive to currency moves across its four export regions — a weak yen inflates consolidated results in yen terms regardless of actual operating performance.
5.2 Valuation
Same assumptions as for HDS, to keep things comparable: FY2030 horizon (4 years), a flat 50%/year revenue growth rate, and the same three net-margin scenarios (Bear 5%, Central 15%, Bull 30%) applied to guided FY2026 revenue for the continuing business (¥276bn) and to 112.02 million shares outstanding (derived from guided FY2026 EPS of ¥202.64 and guided net income of ¥22.7bn). Useful reference point: THK’s current net margin comes out at roughly 17% TTM — already above the Central scenario (15%) and close to the Bull scenario (30%), the reverse situation from HDS.
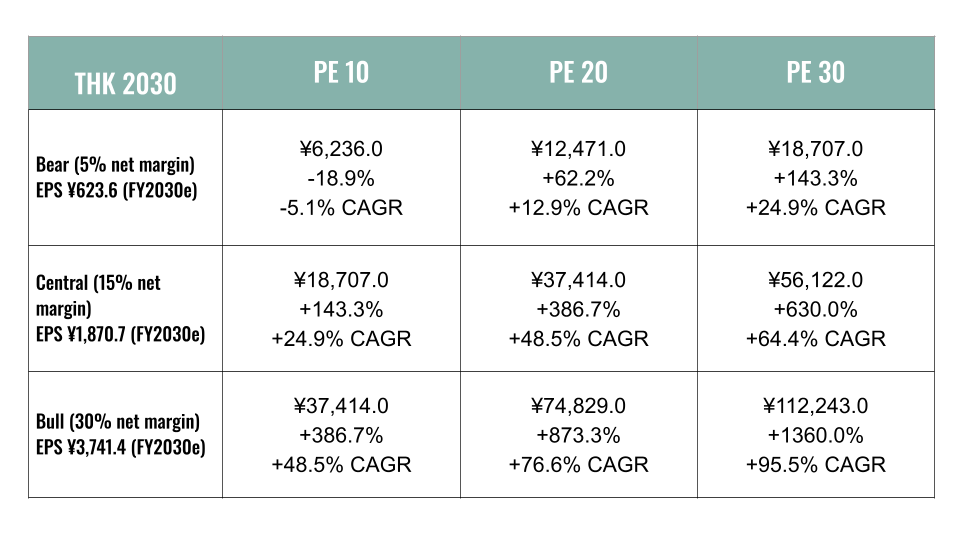
Like HDS, THK is too expensive in the absence of a bottleneck and a great price if the bottleneck is confirmed — but the tipping point is different: even under the Bear scenario (5% net margin), the stock is already undervalued by 23% to 143% depending on the multiple. That mostly reflects the smaller size of the revenue base used (¥276bn, smaller than HDS’s) relative to the same 50%/year growth assumption — a signal that should be read with caution, see the caveat below.
An important methodological caveat, even more so than for HDS: looking at the past, THK’s revenue growth runs more in the range of 10-15%/year over a full cycle (consistent with its own FY2026 guidance of +14.8%), not a sustained 50%/year — over 2021-2025, its revenue went from ¥318bn to ¥223bn depending on the machine-tool/semiconductor capex cycle phase, a cyclical pattern rather than a structural trend at that pace. For the 50%/year assumption to become coherent, it would take a genuine bottleneck effect combining both a price effect (pricing power regained on linear motion) and a volume effect (humanoid demand adding to the existing industrial cycle rather than replacing it) — not just a normal cyclical rebound in semiconductor capex. The table above should therefore be read as a methodological comparability exercise with HDS, not as a reference projection for THK: on a growth assumption closer to its own history (12-15%/year), the current price would remain considerably more stretched, as the earlier calculation showed (forward PE of ~38x versus a historical 15-18x).
5.3 Sizing
The name has cleared the quality bar (a disciplined refocusing via the automotive divestiture, sound governance, aligned incentives, real tailwinds) but the price question remains entirely dependent on which growth assumption is used — on the shared 50%/year assumption, the valuation looks cheap; on a realistic assumption based on its own history (12-15%/year), it stays stretched (forward PE ~38x versus a historical 15-18x).
On THK: I’m buying in at 1% of the total portfolio (when the momentum will get better) — a more cautious size than HDS (2%), consistent with the gap between the two growth readings still being too wide to fully resolve. Adding to the position will depend on confirmation, over two consecutive quarters, that growth is moving closer to the humanoid/AI pace rather than the historical semiconductor/machine-tool pace; failing that, a price pullback toward a PE near 15-18x (THK’s normal historical range) or toward its 200-week moving average would be the alternative trigger.
Sources
I have no formal obligation to disclose my sources, but I want to express that my articles are inspired by Ren’s articles and ideas, which I strongly recommend: https://substack.com/@renstocks
As well as Micron’s and SanDisk’s 10-Q and 10-K filings.
Important Disclosure & Disclaimer
All content published by JB Peter on this platform is strictly for educational and informational purposes. It does not constitute investment, financial, legal, or tax advice, nor does it represent a personal recommendation or solicitation to buy or sell securities. This research is operated by ORIACON (SASU) and reflects independent corporate analysis. Every reader must conduct their own independent research (Due Diligence) or consult a licensed professional before making any financial decision, as financial markets involve a high risk of capital loss. At the time of writing, ORIACON or the author HOLD shares in the companies analyzed in this article. Following this publication, ORIACON and the author reserve the right to buy, sell, or modify positions in any security mentioned at any time, without prior notice to readers or subscribers