Generating alpha on mega-cap stocks is, in theory, simple: buy quality during a temporary moment of fear, sell once the fear passes. Everyone knows the principle. Almost nobody executes it, because the hard part isn’t the principle — it’s telling a temporary discount apart from a structural one, in real time, before the outcome is obvious.
This question becomes considerably more interesting inside a tax-free wrapper, where the full magnitude of a re-rating compounds without erosion.
Microsoft is currently trading at a PE of 22x — its lowest valuation in a decade, last seen briefly during two narrow windows in the last ten years. The business is not showing any of the symptoms that usually accompany a multiple this depressed. Azure has accelerated for five consecutive quarters. Management is publicly admitting it cannot install GPUs fast enough — not because demand is missing, but because there isn’t enough electricity to plug them in.
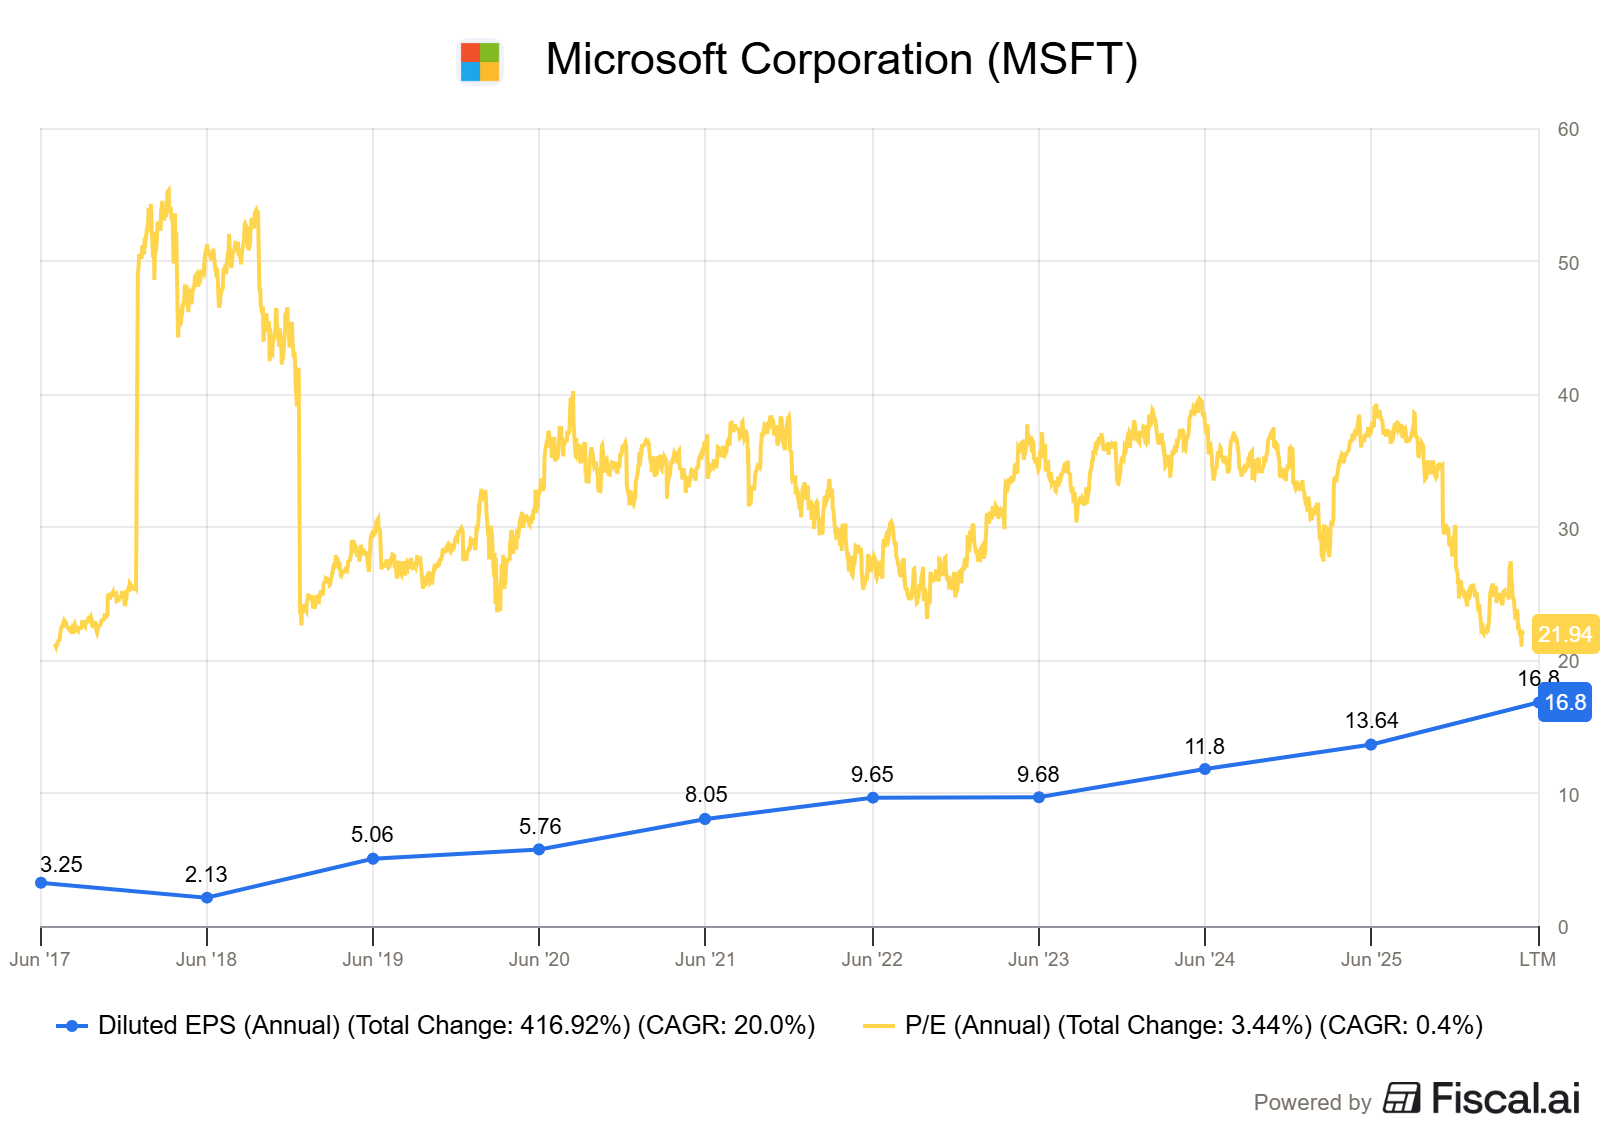
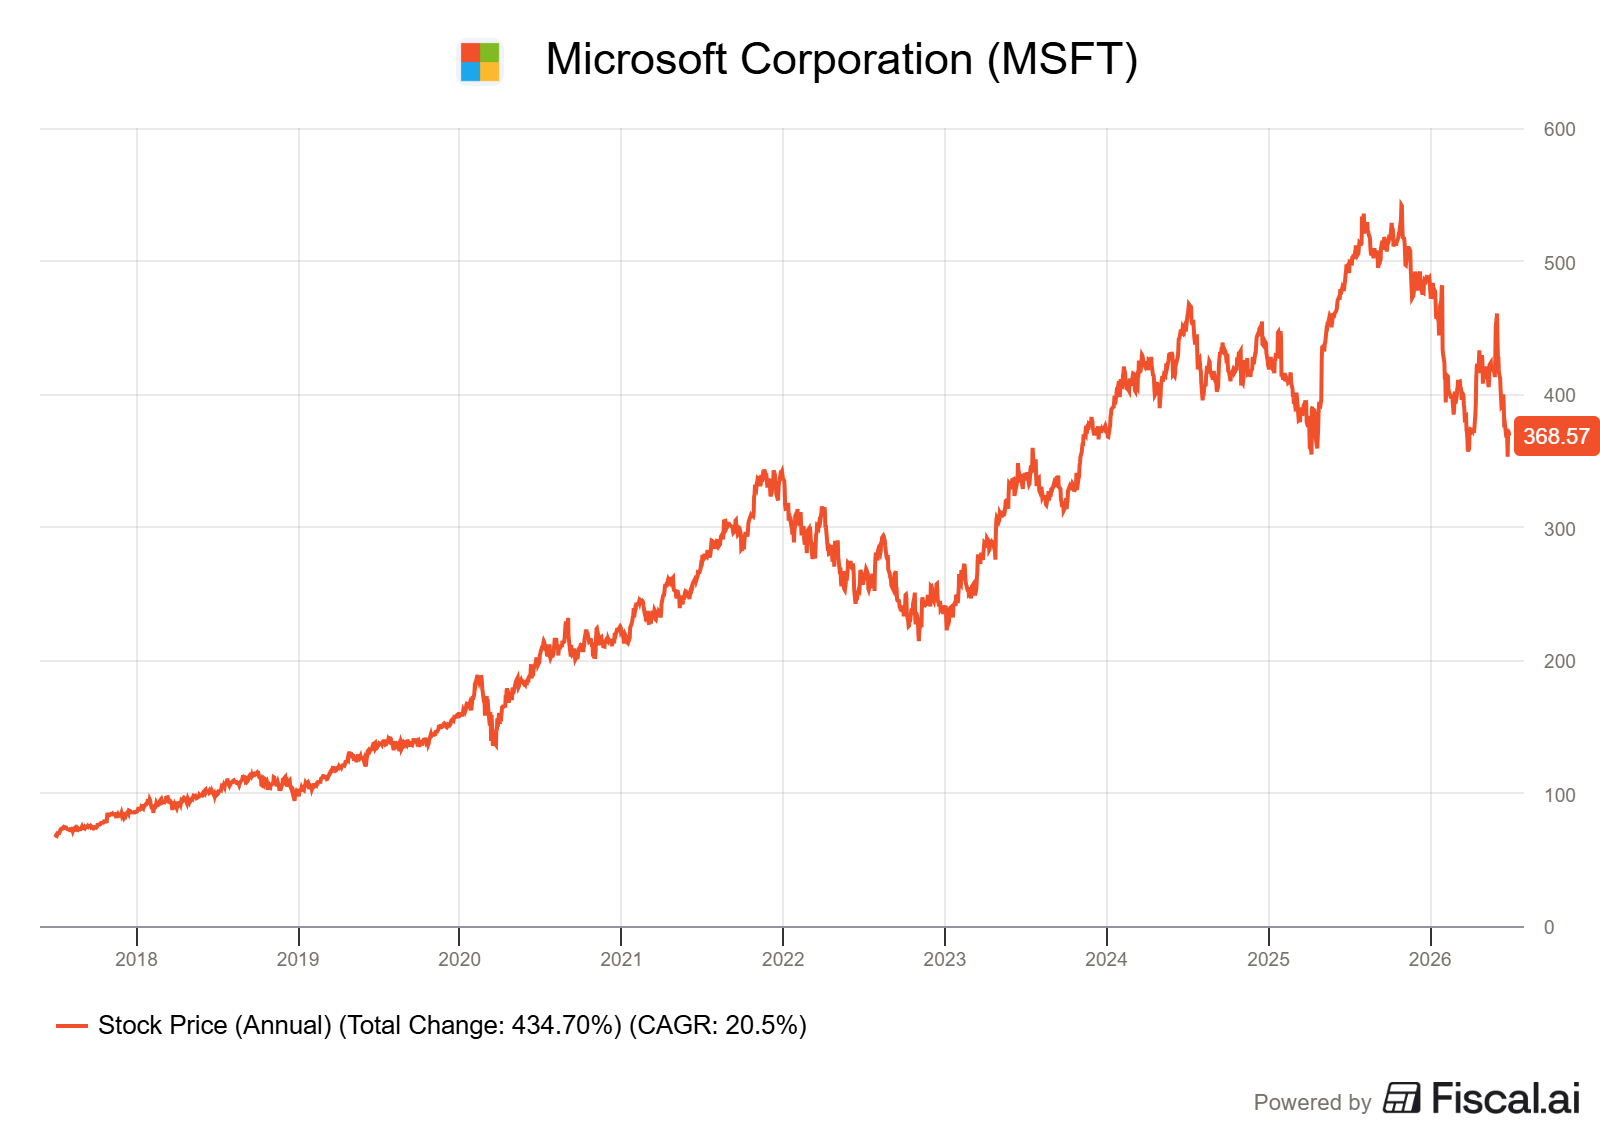
And yet the stock has fallen hard. The market has a name for what’s worrying it: OpenAI. A partner Microsoft owns 27% of, has committed $13 billion to, and increasingly depends on for the AI growth story that justifies a $190 billion capital expenditure plan. No audited financial statements exist for OpenAI, and none will until an IPO whose timing remains genuinely uncertain.
This article starts with the business itself — what Microsoft actually does, how it makes money, who its customers and suppliers are, and what makes it structurally difficult to displace. From there, it examines the two competing theses: why the market is afraid, and whether that fear holds up under scrutiny. The valuation section translates those arguments into a scorecard with concrete scenarios. The article closes with portfolio considerations and a conclusion.
I know you’re busy, so I always start with a summary called The short version. If that’s all you have time for, that’s fine. The rest of this article explains why.
The Short Version
Microsoft is the world’s dominant enterprise software and cloud platform — hundreds of millions of users locked into Windows, Office, and Azure not by preference but by switching costs that compound the longer they’re deployed. The stock has fallen roughly 25% from its 2025 peak. The market has one explanation: a $190 billion AI capital expenditure plan whose return isn’t yet visible in free cash flow, and a growing dependence on OpenAI — a partner Microsoft owns 27% of, has committed $13 billion to, and cannot audit, because no audited OpenAI financial statements exist.
My view: the market is pricing one real, bounded risk as though it were a structural one. Azure has accelerated for five consecutive quarters, with management openly admitting the constraint is electricity to power GPUs, not demand for them. Operating margin has expanded every year since FY2023. Two independent hyperscalers — Alphabet and Amazon — are reporting the same pattern: AI capex translating into expanding margins, not eroding them. None of that depends on OpenAI’s solvency.
EPS has compounded at roughly 18-20% a year for three years. The stock has compounded more slowly. That gap is the trade.
At a PE of 25x — still below the ten-year average of roughly 32x — the central scenario in the valuation scorecard implies a price near $795 within 3.5 years, a return of +113%. The only scenario in the scorecard that produces a loss combines a multiple below the broader software sector’s median with EPS growth cut roughly in half from its recent pace, sustained for years. That is not a base case.
Understanding Microsoft’s business, supply chain and environment
History
Microsoft was founded in 1975 and built its first fortune on a near-monopoly in desktop operating systems and office productivity software. For two decades, that dominance was nearly unchallengeable — and nearly fatal to the company’s long-term relevance. The early 2010s saw Microsoft miss the mobile transition almost entirely, dismissed by much of the market as a legacy software vendor in terminal decline.
The turnaround began in 2014, when Satya Nadella became CEO and redirected the company toward cloud computing and a cultural shift away from internal competition toward what he termed a “growth mindset.” Azure, a minor product line at the time, became the centerpiece of a decade-long transformation. By the mid-2020s, Microsoft had gone from a company written off as irrelevant to one of the most valuable companies in the world.
Two recent decisions define the current chapter. In October 2023, Microsoft completed the acquisition of Activision Blizzard for $75.4 billion, its largest deal in history, consolidating its position in gaming content. And since 2019, it has built an increasingly deep partnership with OpenAI — an investment of $13 billion in exchange for a 27% equity stake and a privileged commercial relationship that has become the centerpiece of the current market debate. That partnership was substantially restructured on April 27, 2026, a change significant enough to warrant its own section later in this article.
The engine: three segments, one platform
Microsoft organizes its business into three reportable segments, each at a different stage of maturity.
Productivity and Business Processes is the historical core: Microsoft 365 Commercial, Microsoft 365 Consumer, LinkedIn, and Dynamics 365. This segment generated $35.0 billion in revenue in the quarter ended March 2026, up 17%, with Microsoft 365 Commercial cloud revenue up 19% and LinkedIn up 12%.
Intelligent Cloud is the growth engine: Azure, server products, GitHub, and enterprise services. Revenue reached $34.7 billion in the same quarter, up 30%, with Azure itself growing 40% — its fifth consecutive quarter of acceleration, a streak that has persisted despite management repeatedly acknowledging that supply, not demand, is the binding constraint.
More Personal Computing is the most mature and most heterogeneous segment: Windows OEM and devices, gaming (Xbox, Game Pass, Activision Blizzard content), and search advertising. It was the only segment to decline in the most recent quarter, down 1%, dragged by a 2% fall in Windows OEM revenue and a 5% decline in Xbox content and services.
Layered across all three segments is Copilot — Microsoft’s attempt to embed AI monetization horizontally rather than concentrate it in a single product line. GitHub Copilot has demonstrated clear, measured value (developers documented as 55% faster on well-scoped coding tasks) and has scaled to 4.7 million paid subscribers. Microsoft 365 Copilot has grown faster in absolute seat count — over 20 million paid seats, up from 15 million the prior quarter — but penetration of the installed M365 base remains low, at roughly 4.4%, and retention appears weaker than GitHub Copilot’s. Management has already begun pivoting the product toward agentic capabilities rather than a generic assistant, an implicit acknowledgment that the first iteration underdelivered.
Customers
Microsoft’s customer base spans individual consumers, small and medium businesses, large global enterprises, public-sector institutions, service providers, application developers, and OEMs. Roughly 80% of the Fortune 500 use Azure AI Foundry. LinkedIn counts 1.2 billion members. Gaming reaches 500 million monthly active users.
One nuance worth naming explicitly, because it complicates the popular “European digital sovereignty” narrative: public-sector deviations from Microsoft are currently concentrated almost entirely in desktop software — France’s planned migration of 2.5 million government workstations to Linux, Germany’s Schleswig-Holstein region, Italy’s Ministry of Defense — not in identity infrastructure or cloud. Active Directory, Entra ID, and Azure consumption remain firmly within Microsoft’s grip even in administrations actively reducing their Windows footprint, most plausibly because the cost-benefit calculation for migrating cost-driven desktop licensing is straightforward, while migrating identity and PaaS-layer infrastructure is not.
Suppliers
Microsoft’s most consequential supplier relationship is also, structurally, its most ambivalent: Nvidia. GPU capacity is the binding constraint on the company’s entire AI growth narrative, and Nvidia is by far the dominant supplier of that capacity — a dependency Microsoft is actively working to reduce through internal silicon development (Maia, Cobalt), though that effort remains early-stage.
The second critical dependency is OpenAI itself, which occupies an unusual dual role: simultaneously a technology partner whose models power Copilot, and the single largest identified consumer of Azure’s own AI compute capacity. Independent analysis of Microsoft’s most recent 10-Q estimates that consumption tied to OpenAI represents the largest single line within Microsoft’s $37 billion AI revenue run rate — though Microsoft itself has not published an official breakdown, and this figure should be treated as a well-reasoned estimate rather than a confirmed fact.
Beyond these two, the 10-K explicitly flags concentration risk in hardware components: “there are few qualified suppliers for certain components of our servers and devices.” Azure AI Foundry also hosts models from third parties — OpenAI, Cohere, DeepSeek, Meta, Mistral, xAI — giving Microsoft a degree of model-layer diversification that reduces, without eliminating, the company’s dependency on any single AI lab.
Competition
Cloud infrastructure. Azure competes directly with Amazon Web Services and Google Cloud Platform in what is effectively a three-player oligopoly. Market share estimates converge around AWS at 30-33%, Azure at 23-28%, and Google Cloud at 11-13% — the three together capturing roughly two-thirds of the global market, with the remainder fragmented among smaller players. Azure has narrowed the gap with AWS over recent quarters rather than widened it, growing 40% against AWS’s 28% in the most recently reported periods.
Productivity software. Google Workspace is Microsoft’s only meaningful direct competitor here, and the two together control the overwhelming majority of the market — though the precise leader depends heavily on methodology. By paid enterprise seats, Microsoft 365 leads decisively, with over 450 million paid seats and roughly 75% of the Fortune 500. By raw domain or account count, Google Workspace is often cited as larger, buoyed by small businesses and education accounts where Google is free or near-free. This is a genuine duopoly with no credible third entrant.
Gaming. Sony’s PlayStation remains the dominant console platform, with Microsoft a consistent second, though Activision Blizzard content and Game Pass subscription economics have strengthened Microsoft’s position on content and recurring revenue even where hardware share lags.
Search and consumer AI. Google Search retains over 90% global market share; Bing and Copilot remain minor players in pure search terms. On the consumer AI chatbot front specifically, ChatGPT’s share of monthly active usage has declined from roughly 85% to around 45% over the past two years as Gemini, Claude, DeepSeek, and others have gained ground — though this metric measures consumer app usage, not enterprise revenue, where Anthropic’s Claude reportedly overtook OpenAI as early as mid-2025.
None of Microsoft’s direct competitors qualifies as a category-definer in the strict sense of having created an uncontested category. The closer candidate for that label sits one layer up the stack: Nvidia, whose dominance in AI compute underwrites the infrastructure all three hyperscalers depend on, and OpenAI, whose generative AI breakthrough effectively created the category Microsoft is now monetizing through partnership rather than head-on competition — a strategic choice that distinguishes Microsoft’s approach from Google’s, which is building Gemini in-house and therefore competes more directly with its own cloud customers in the AI lab space.
Competitive advantage
Most competitive-moat frameworks converge on a single question: why can’t a well-funded competitor simply replicate what this business does? For Microsoft, there are three distinct, mutually reinforcing answers — a fourth, the deepest one, is developed separately in the bull thesis below.
Economies of scale. The 10-K states plainly that the company’s datacenters “deploy computational resources at significantly lower cost per unit than smaller ones” — a direct structural barrier to entry that no new entrant can replicate without comparable capital intensity. The 2026 capital expenditure guidance of roughly $190 billion is itself a barrier: few companies on earth can fund infrastructure at this scale.
Network effects. LinkedIn’s 1.2 billion members and GitHub’s developer ecosystem both compound in the classic two-sided sense — more users make the platform more valuable to every other user.
A self-reinforcing, multi-layer lock-in system. Unlike a single-axis moat, Microsoft’s advantage is a system in which the operating system layer, the line-of-business software layer, the PaaS layer, and now the AI layer all reinforce one another rather than standing as four separate, independently defensible barriers. This is the single most important point of this analysis, and it deserves more than a paragraph — it’s developed in full in the bull thesis below.
Financials
Key financial metrics
Comments on the numbers above
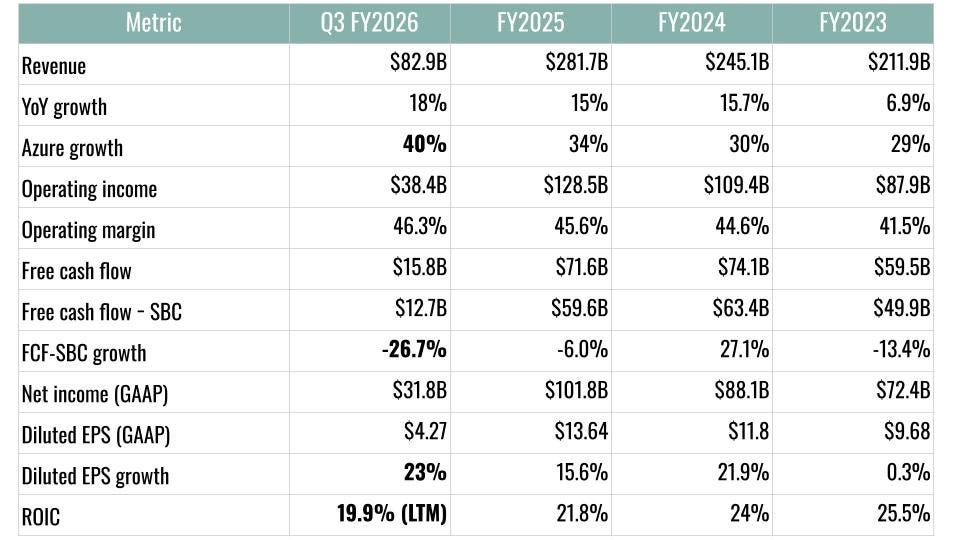
On the free cash flow decline. FCF fell to $71.6B in FY2025 from $74.1B in FY2024 — not because operating cash generation weakened (it grew 15% to $136.2B) but because capital expenditure grew faster, up 45% to $64.6B. This is a capex story, not an earnings-quality story. FCF minus stock-based compensation tells the same story more starkly: $63.4B in FY2024 was the peak of the period, falling to $59.6B in FY2025, and the pressure has only intensified since — Q3 FY2026 alone saw FCF-SBC fall 26.7% year over year, the steepest decline in the series. Worth noting: this isn’t purely a recent, AI-driven phenomenon. FCF-SBC was already down 13.4% in FY2023, well before the current capex cycle began in earnest — the tension between operating cash generation and capital intensity has a longer history than the AI narrative alone would suggest.
On the volatility inside net income tied to OpenAI. Microsoft’s equity-method stake in OpenAI has produced wildly different quarterly impacts: a $4.1 billion pre-tax loss in Q1 FY2026, a $7.6 billion gain in Q2 FY2026 — driven by a revaluation following the April 2026 restructuring, not by any improvement in OpenAI’s underlying profitability — and a near-neutral $14 million loss in Q3 FY2026, down sharply from a $583 million loss in the same quarter a year earlier. This swings on Microsoft’s use of the hypothetical-liquidation-at-book-value (HLBV) accounting method, which can produce results that diverge meaningfully from a simple pro-rata share of OpenAI’s reported net income. None of this reflects a change in OpenAI’s actual cash burn, which independent estimates continue to place in the tens of billions annually.
On Azure’s acceleration despite a binding supply constraint. Azure growth has climbed in every period shown — 29% (FY2023), 30% (FY2024), 34% (FY2025), 40% (Q3 FY2026) — five consecutive quarters of acceleration, each beating prior guidance. That is the opposite of what you’d expect if AI demand were overstated. CFO Amy Hood has stated explicitly across multiple quarters that supply, not demand, remains the limiting factor, adding in the Q3 FY2026 call that the company expects to “remain constrained at least through 2026” — an admission that costs the company growth in the short term and therefore carries more credibility than a typical demand-side sales pitch.
On margin compression in the cloud segment. Microsoft Cloud gross margin fell to 66% in Q3 FY2026, which the company attributes directly to the cost of scaling AI infrastructure, partly offset by efficiency gains in Azure and Microsoft 365 Commercial cloud. Operating margin at the company level has nonetheless continued to expand throughout the period (41.5% → 44.6% → 45.6% → 46.3%), helped by declining total headcount — discipline below the gross-margin line is absorbing some of the pressure from infrastructure scaling rather than letting it flow straight through to the bottom line.
On FY2023 as the trough year. FY2023 stands out as the one period in this table where net income (-0.4%) and diluted EPS (+0.3%) were essentially flat — a pause following the post-pandemic deceleration, before the cloud and AI reacceleration that has driven double-digit growth in every subsequent year shown.
ROIC trend — a longer pattern than the AI capex story alone
The current ROIC of 19.9% is not an isolated trough created by the AI investment cycle — it is the continuation of a decline that began five years earlier. According to Fiscal.ai data spanning fiscal years 2017 through the trailing twelve months, Microsoft’s ROIC peaked at 31.4% in FY2021, held near that level through FY2022 (30.6%), then declined in successive years: 25.5% (FY2023), 24% (FY2024), 21.8% (FY2025), 19.9% (LTM). Over the same nine-year window, diluted EPS rose from $3.25 to $16.80 — a 20.0% CAGR, against a roughly flat ROIC CAGR of -0.8% over the same period.
The two-phase nature of this decline matters for how the AI capex debate should be framed. The first phase, FY2021 to FY2023, predates the current AI infrastructure buildout and likely reflects post-pandemic normalization combined with digesting the integration of the Activision Blizzard acquisition. The second phase, FY2024 onward, coincides with and likely reflects the accelerating capital intensity discussed throughout this section. Treating the entire nine-year decline as evidence that “AI investment is destroying returns on capital” overstates the case — roughly half the decline happened before the AI capex cycle began.
What the trend does confirm is the mechanism already described above: Microsoft is generating substantially more absolute profit (EPS more than doubling since FY2021) while doing so on a capital base that is growing even faster — precisely the signature of a company in a heavy investment phase, where marginal returns on newly deployed capital dilute the average ROIC even as total earnings power continues to expand.
Geographic revenue
Microsoft discloses a simple geographic split: the United States accounted for $144.5 billion, or 51.3%, of fiscal 2025 revenue, with the remaining 48.7% generated elsewhere. The company notes that no individual country outside the US exceeds 10% of revenue, so no further granularity is published.
Capital expenditure — pace and intent
Capex has compounded at a rate that materially outpaces revenue growth: $28.1B (FY2023) → $44.5B (+58%, FY2024) → $64.6B (+45%, FY2025) → roughly $190B guided for calendar 2026 (+61% on a comparable basis). Sector-wide, the four largest AI spenders (Microsoft, Alphabet, Amazon, Meta) are projected to spend a combined $505 billion in 2026, up from roughly $366 billion in 2025 — Microsoft’s acceleration is not an outlier, it’s part of an industry-wide pattern.
Roughly two-thirds of this spend goes to short-lived assets (GPUs and CPUs, depreciated over roughly two years), and one-third to long-lived assets (buildings, power infrastructure, land, increasingly financed through leases rather than direct construction). Of the $190B guided for 2026, an estimated $25B reflects component price inflation rather than incremental capacity — spend that doesn’t buy more compute, just buys the same compute at a higher price.
Capacity allocated this way is not earmarked for a single segment in Microsoft’s reporting — it is corporate spend that flows simultaneously into Azure consumption, into Microsoft’s own first-party AI products (Copilot, GitHub Copilot), and into internal R&D acceleration. Management has explicitly cautioned analysts against drawing a mechanical one-dollar-to-one-dollar link between capex and Azure revenue specifically.
Balance sheet and leverage
Total debt: $43.15B. Stockholders’ equity: $343.5B. Debt-to-equity: 0.13. Cash and short-term investments: $94.6B — exceeding total debt, putting the company in a net cash position. EBITDA (operating income plus D&A): approximately $162.7B. At this scale, total debt represents roughly 0.34 years of operating income — about four months — making leverage a non-issue for Microsoft.
A genuine off-balance-sheet item worth flagging: $92.7 billion in datacenter lease commitments not yet commenced.
Accounting notes worth flagging
The auditor is Deloitte & Touche LLP, with an unqualified opinion on both the financial statements and internal controls. Two Critical Audit Matters were identified: revenue recognition complexity (standard for a business combining licensing and cloud contracts) and uncertain tax positions (linked directly to the IRS dispute below). Neither suggests irregularity.
The IRS has assessed approximately $28.9 billion in additional tax related to transfer pricing for tax years 2004-2013, which Microsoft is contesting and has not fully provisioned. Separately, $541 million in litigation accruals are recorded, with an estimated additional $600 million in reasonably possible losses beyond what’s already booked — modest figures relative to a $619 billion balance sheet.
Management
Satya Nadella — CEO since 2014
Nadella inherited a company widely regarded as past its prime and rebuilt its growth trajectory around cloud and, more recently, AI. His public communication style is notably more measured than the typical “platform shift” rhetoric he himself favors — quarterly calls remain anchored in specific operational metrics rather than visionary abstraction, a contrast worth noting given how aggressively the company is spending on an unproven return.
The clearest data point on his character as an operator: when cybersecurity incidents drew public criticism in 2024, Nadella voluntarily reduced his own cash bonus by roughly 50% — from $10.66 million to $5.2 million. The board has since added security as a standalone compensation criterion for senior executives for the first time. This is the same instinct Microsoft’s M365 Copilot pivot reflects at the product level: naming an underperforming bet rather than quietly burying it.
Skin in the game
Nadella’s FY2025 compensation totaled $96.5 million — but the figure that matters more than the total is its composition. 87% of it, $84.2 million, came in the form of stock awards rather than cash, vesting over three to four years and tied to performance metrics including ROIC and relative shareholder return. This is a distinct, individually negotiated package — separate from the broader $12 billion in company-wide stock-based compensation expensed across the workforce — but it illustrates the same principle the board has built into its evaluation framework: pay tracks long-term capital returns and shareholder outcomes, not just short-term financial results. The board’s own scoring of his FY2025 performance reflects that blend — 117% of target on financial metrics, 151.67% on operational assessment — with security added as a standalone criterion for the first time following the cybersecurity incidents discussed above.
Capital allocation discipline
Across the criteria that typically separate disciplined capital allocators from undisciplined ones: capital is unambiguously directed toward the highest-return opportunity (Azure/AI capex dwarfs spend on flatter segments), there has been no pattern of frequent, poorly integrated acquisitions (Activision Blizzard remains the only major deal in the recent period, and it is performing), buybacks have been modest relative to free cash flow ($13.0B in FY2025 against $71.6B in FCF, with $57.3B of a $60B authorization still undeployed), and the board has demonstrably updated its own oversight criteria in response to operational failures rather than leaving them static.
The one mark against the company on this dimension: communication around the OpenAI relationship was, by external accounts, opaque in its early stages — the word “primarily” carried a great deal of unstated weight in describing the source of equity-method losses before Microsoft began isolating the figure explicitly from Q1 FY2026 onward. Transparency improved under pressure rather than arriving proactively.
Two thesis
Bear thesis
Why the stock has fallen
The decline is not explained by a deterioration in fundamentals. Revenue grew 18% in the most recent quarter, Azure has accelerated for five consecutive quarters, and operating margin has expanded every year shown in the table above. The stock fell because the market repriced the risk of a capital expenditure cycle whose return is not yet fully visible in free cash flow.
Three factors combined:
First, capital expenditure guidance that came in well above consensus — $190 billion for calendar 2026 against a Visible Alpha estimate of $154.6 billion — with management attributing roughly $25 billion of that to component price inflation alone, not incremental capacity.
Second, a broader market debate about whether AI infrastructure spending across the hyperscaler cohort will generate returns commensurate with its scale.
Third, and most specifically to Microsoft, a growing dependence on OpenAI — a partner the company owns 27% of, has committed $13 billion to, and whose contractual Azure commitments now account for the majority of the deceleration gap between headline cloud growth and growth excluding that single relationship.
The OpenAI exposure gave the bears a concrete, recurring data point. It is the one argument in this section that does not unwind cleanly under scrutiny.
The bear arguments
Dependence on an unaudited, cash-burning partner. This is the central, legitimate concern, and it deserves to be unpacked as two distinct scenarios rather than one vague risk, because each implies a different magnitude of consequence for Microsoft.
OpenAI is not a public company. It has never filed audited financial statements, and won’t until an IPO whose timing remains uncertain — a confidential S-1 was filed in June 2026, but estimates of when a listing might actually happen range from late 2026 to sometime in 2027, with most analysts leaning toward the later end. In the absence of audited numbers, what’s available is a series of internal projections leaked to the press, and those projections have moved dramatically and repeatedly: cumulative revenue estimates for 2030 have been revised from roughly $85 billion to as low as $39 billion, then back up to roughly $280 billion, within the span of a few months — a swing of nearly sevenfold between the low and high figures, none of it audited, none of it confirmed by OpenAI itself. That volatility in OpenAI’s own internal forecasting is the backdrop against which both scenarios below need to be read.
In the bankruptcy scenario, the direct accounting impact is bounded — a write-down of at most the $13 billion invested, absorbable in a single quarter against net income exceeding $100 billion annually. The more consequential impact is operational: a meaningful share of the $37 billion AI revenue run rate and the 99% year-over-year growth in remaining performance obligations is tied to OpenAI’s own Azure consumption — strip that out, and RPO growth falls to roughly 26%, still healthy but a different growth story than the headline figure implies. Physical capacity would not be destroyed — the binding constraint today is electricity, not demand, meaning a queue of other customers exists to absorb freed capacity — but reallocation would not be instantaneous, and the narrative hit to Azure’s growth rate would be immediate.
In the continuous financing scenario — OpenAI survives but requires large-scale, repeated financing for years — the relevant question shifts from solvency to financing risk. OpenAI’s path to the IPO it has confidentially filed for remains genuinely uncertain in timing, and even a successful listing raising upward of $60 billion would not, on its own, close a cumulative cash burn gap that internal projections place in the hundreds of billions through 2030. Microsoft would likely continue benefiting from this relationship through royalties and Azure consumption regardless of OpenAI’s path to profitability — but the market’s confidence in the durability of that arrangement depends on financial visibility that, as things stand, does not exist.
Margin compression from infrastructure scaling. Microsoft Cloud gross margin has fallen to 66%, and the ratio of capital expenditure to operating cash flow has crossed 50% — a level that concerns analysts more than the absolute dollar figure. The bear case treats this as evidence that the capital intensity of AI-driven growth is structurally different, and structurally worse, than the software-centric model that built Microsoft’s historical margin profile.
European public-sector erosion. Several European governments — France, Germany’s Schleswig-Holstein region, Italy’s Ministry of Defense — have announced migrations away from Microsoft desktop software, framed publicly around digital sovereignty.
What if the bear thesis is really true?
If every element above plays out simultaneously — Azure’s market share gains stall, cloud margins continue eroding under the weight of infrastructure scaling, OpenAI is forced to materially scale back its Azure commitments for lack of financing, and European public-sector erosion spreads beyond the desktop into infrastructure layers — the investment thesis would shift fundamentally. Microsoft would no longer be a quality compounder temporarily mispriced; it would be a mature company in a prolonged overinvestment phase, carrying fixed costs (the $92.7 billion in datacenter leases not yet commenced) against demand that failed to materialize as planned. In that scenario, a PE of 22x would not be cheap — it would still be too expensive for a business facing structural margin erosion and a sharply slower growth trajectory than the one currently priced in.
None of the first three signals — Azure share, cloud margins, European desktop migration — currently shows evidence of this trajectory: Azure has accelerated in every one of the last five quarters, not decelerated; operating margin has expanded every year since FY2023; and European public-sector deviations remain almost entirely confined to desktop software, with identity infrastructure (Active Directory, Entra ID) and Azure consumption remaining intact even in administrations actively reducing their Windows footprint — most plausibly because the cost-benefit calculation for migrating cost-driven desktop licensing is straightforward, while migrating PaaS-layer infrastructure is not. The fourth signal, OpenAI’s financing trajectory, remains genuinely unresolved and is the one component of this bear case that current data cannot rule out.
Bull thesis
The market is pricing one fear and ignoring three independent confirmations that AI capital expenditure is profitable
CFO Amy Hood stated directly in the Q3 FY2026 earnings call, in response to an analyst question comparing AI margins to historical cloud margins, that margins on AI products and tools are already better than cloud margins were at a comparable stage of scale — a claim that is verifiable over time rather than a vague promise, and one the company has every incentive not to make if it weren’t broadly true given how closely analysts now track this exact metric.
That claim does not stand alone. Alphabet was the only one of the three major hyperscalers to “convince investors” in the most recent earnings cycle, according to financial press coverage, on the strength of a clear acceleration in Google Cloud growth that the market read as direct evidence of capex translating into results. Amazon corroborates the pattern with harder numbers: group operating margin reached a record 13.1% in the same period it announced its most aggressive capital expenditure plan in company history — $200 billion for 2026, $344 billion cumulative through 2027 — while AWS itself accelerated to 28% growth. An independent calculation based on AWS’s current margin and growth rate puts the incremental ROIC on AI capital expenditure above 25-30%, comfortably above any reasonable estimate of the sector’s cost of capital.
Three independent companies, three different competitive positions, three confirmations of the same underlying pattern: AI infrastructure investment is not destroying returns on capital at the margin — it is being deployed against demand that is currently outstripping supply, evidenced most directly by management at all three companies admitting, repeatedly and on the record, that capacity rather than demand is the binding constraint on growth. That kind of admission costs a company near-term growth and credibility with the market if it overspends on unrealized demand; it is not the kind of claim a management team makes lightly, and it is the opposite of what you’d expect to hear if the spending were not paying off.
A lock-in system that compounds across every layer of the stack — and gets stronger, not weaker, the deeper AI is embedded
Microsoft’s most durable advantage is not technological superiority at any given moment — it is the cost of leaving. That cost is best understood through specific, lived examples rather than abstraction. A notary running case-management software that only runs on Windows Server cannot migrate without rewriting mission-critical, regulator-adjacent software they did not write and cannot easily replace — the alternative isn’t switching platforms, it’s a multi-year engineering project with legal exposure attached. A systems administrator managing several thousand endpoints does not consider Linux a realistic alternative not because Linux is technically inferior, but because the tooling, the talent pool, and years of institutional muscle memory are built entirely around Active Directory — propose removing it, and the practical response is closer to resignation than migration planning. Independent software vendors who built their products on .NET and SQL Server, on-premise, propagate that same lock-in to every one of their own customers in turn, multiplying its reach far beyond what market-share statistics for Windows or Azure alone would suggest.
This switching-cost moat has a second layer that matters specifically for the AI debate. Infrastructure-as-a-Service workloads — raw virtual machines — are relatively portable between cloud providers; a VM migrates from Azure to AWS with moderate effort. Platform-as-a-Service workloads — applications built directly against proprietary managed services like Azure SQL Database, Azure Functions, or Entra ID — are not; migrating them means rewriting application code, not simply redeploying infrastructure elsewhere. Enterprise AI today is being built almost exclusively on this PaaS layer — Copilot integrations wired directly into Entra ID and Microsoft Graph, agentic workflows built on Azure AI Foundry — which means each new AI deployment deepens the same lock-in rather than creating an independent, swappable product. An organization already entrenched in Windows and Active Directory is also the organization most likely to have built its cloud workloads on Azure PaaS for integration convenience in the first place — the layers reinforce each other rather than standing as separate, independently defensible barriers. The European public-sector migrations discussed in the bear case make this point empirically: even governments with explicit political mandates to reduce dependence on Microsoft have, so far, only managed to substitute the desktop layer, leaving identity and cloud infrastructure untouched.
A demonstrated competence in structuring contracts, not just building products
The April 2026 restructuring of the OpenAI partnership is a recent, concrete illustration of this. Microsoft gave up cloud exclusivity — a real concession, made under pressure from a partner seeking to diversify its infrastructure risk — in exchange for a technology license extended to 2032, royalties capped at 20% of OpenAI’s revenue through 2030 regardless of whether OpenAI achieves AGI, a right of first refusal on capacity, and the $250 billion Azure spending commitment discussed above. The same instinct shows up at the product level: Microsoft 365 Copilot has grown to over 20 million paid seats despite penetration of the installed base remaining low and usage retention appearing weaker than GitHub Copilot’s — the company is successfully monetizing a product whose standalone value proposition remains debated, by bundling it into existing enterprise contracts rather than relying on the product winning on merit alone. This is the same mechanism, applied at different scales: Microsoft’s economic engine has historically depended less on having the best product at any given moment than on making the cost of leaving — or the cost of not adopting what’s already embedded in an existing contract — higher than the cost of staying.
The valuation gap. EPS has compounded at roughly 18-20% annually over the period shown in the financials table. The stock, over a comparable multi-year window, has compounded at a meaningfully slower rate — the PE has compressed from a ten-year average of roughly 31-33x to 22x today, the lowest level in a decade.
Catalysts
Earnings. A quarter where the capex-to-free-cash-flow ratio stabilizes or improves — even without a major beat on revenue — would likely matter more to sentiment than another quarter of headline growth, since the market’s current concern is specifically about cash conversion, not top-line demand.
Structural. Stabilization or further clarification of OpenAI’s financing path — whether through a successful IPO process or continued evidence that its Azure commitments are being honored at scale — would directly address the one bear argument that current data cannot resolve.
Macro. A shift toward lower interest rates would mechanically benefit the valuation of long-duration growth compounders as a class, Microsoft included — though the 2022 precedent, when Microsoft fell further than the broader index during the rate-hiking cycle, is a reminder that this sensitivity cuts in both directions.
What would invalidate the bull thesis
Four signals worth monitoring every quarter:
The capex-to-operating-cash-flow ratio continuing to deteriorate without stabilization beyond 2026
Azure growth excluding OpenAI’s contractual commitments (currently estimated around 26%) beginning to decelerate meaningfully
Continued, unresolved deterioration in OpenAI’s equity-method losses without a new restructuring in Microsoft’s favor
Commercial RPO converting to recognized revenue at a materially lower rate than the roughly 30% management has signaled for the next twelve months
None of these have appeared as of the most recent quarter reported. When one does, the thesis deserves reassessment.
Blind spots
The exact breakdown of the $37 billion AI revenue run rate by product and by customer is not published by Microsoft. Independent analysis of the most recent 10-Q estimates that OpenAI-linked Azure consumption represents the largest single component, but this remains a reasoned inference rather than a confirmed figure — Microsoft has not isolated it, and this should be revisited once the company provides more granular disclosure, if it ever does.
The precise terms governing newly signed datacenter lease commitments — early termination clauses, penalty structures — are not public. What is known is that roughly 200 MW of pre-commencement capacity has been cancelled with at least two operators, while market-wide lease terms have hardened in landlords’ favor on new agreements, meaning the flexibility demonstrated on cancelled commitments may not extend to leases signed going forward.
The degree to which line-of-business software lock-in protects Microsoft’s enterprise base cannot be precisely quantified from public data — no reliable figure exists for the share of enterprise applications built on the Windows/.NET/SQL Server stack versus portable alternatives. The argument rests on structural logic and specific, verifiable examples rather than an aggregate statistic, and should be read accordingly.
Valuation
This section is the output of everything above — not a standalone recommendation. The numbers only make sense if you’ve read the two thesis section. A valuation without a thesis is just a spreadsheet.
The metric
PE TTM, based on GAAP net income as published — no normalization. This is a deliberate departure from how this kind of section is sometimes built. The volatility inside Microsoft’s reported earnings tied to OpenAI (a $4.1 billion loss one quarter, a $7.6 billion gain the next, a near-neutral $14 million the quarter after that) is recurring and structural rather than a one-time, isolable charge — stripping it out trimester by trimester would introduce more judgment and arbitrariness into the number than it would remove. The published GAAP figure is taken as-is; its composition is discussed in the financials section above rather than adjusted away here.
At a current price of roughly $373, the PE TTM stands at approximately 22x — against a ten-year average of roughly 31-33x, and the lowest level the stock has traded at in a decade.
The scorecard
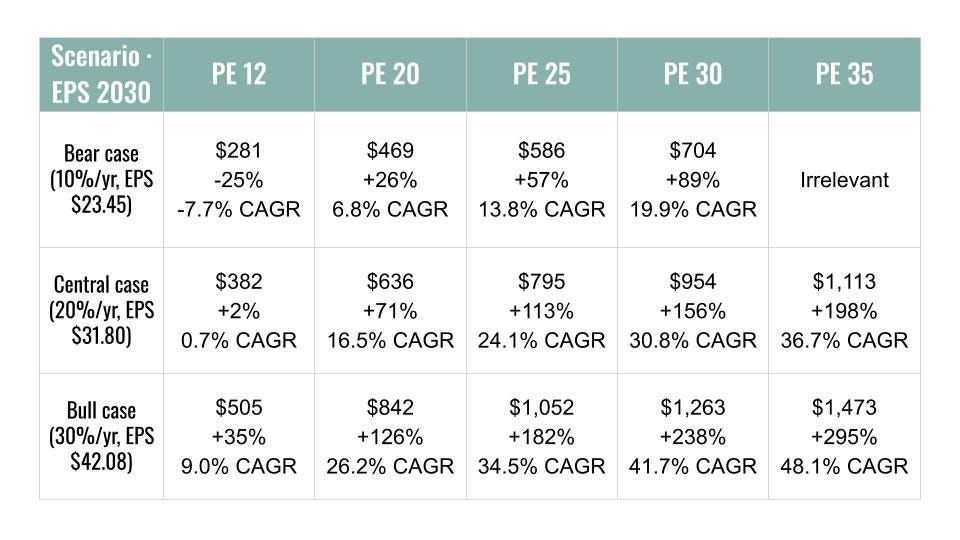
The table below uses EPS TTM of $16.80, a 3.5-year horizon to January 1, 2030, and three growth scenarios. Bear case assumes 10% annual EPS growth — roughly half the rate Microsoft has delivered over the past three years. Central case assumes 20%, in line with recent history. Bull case assumes 30%, reflecting continued AI-driven acceleration. Combinations that are internally contradictory — a bear earnings trajectory paired with a bull-level multiple, or vice versa — are marked irrelevant.
One important caveat: all figures in the scorecard are pre-tax and pre-fees. The actual return in your hands will depend on your tax situation, the investment vehicle you use, and any transaction costs. A gain of +113% in a taxable account is not the same as +113% in a tax-sheltered envelope. Run the numbers for your own situation before drawing conclusions.
One scenario this scorecard does not attempt to price: a broad market selloff unrelated to Microsoft’s own fundamentals — a recession, a credit event, a systemic AI-sector repricing. Any of these could push the stock below the bear case shown here, temporarily, independent of the company’s underlying performance. The scorecard maps where the stock could trade if the thesis plays out roughly as described; it says nothing about what the market does in between.
How to read this
The only scenario that produces a loss is a PE of 12x combined with EPS growth slowing to 10% a year — a multiple below the median of the broader software sector and a growth rate roughly half of what Microsoft has delivered over the past three years, sustained through 2030. That is not a base case. It requires the AI capex cycle to fail to generate meaningful returns and the multiple to compress well past anything seen even during the past decade’s lowest points.
The central case at PE 25x — $795, +113%, 24.1% CAGR — requires no heroic assumptions. It prices the business at a multiple still below its own ten-year average, with earnings growing at a rate close to what the company has already delivered. That is what a re-rating looks like when a sentiment-driven discount unwinds without requiring the bull case to be right.
The asymmetry
The realistic downside is contained to scenarios that combine both a growth slowdown and a multiple well below anything the stock has historically traded at, sustained over multiple years. The realistic upside does not require the AI investment cycle to be a triumph — it requires it not to be a failure. That gap, not any single price target, is the investment case.
Portfolio considerations
Sizing
This is structured as an initial position — sized to put real capital behind the conviction expressed in this article, not as a maximum allocation. The reasoning follows directly from the bear thesis section above: three of the four risks identified there don’t hold up under scrutiny with current data, but the fourth — OpenAI’s financing trajectory — remains genuinely unresolved. A position sized for full conviction would be premature when one material part of the thesis depends on visibility that doesn’t yet exist.
The stop is not a price. It is a thesis: if the capex-to-operating-cash-flow ratio continues deteriorating without stabilization beyond 2026, if Azure growth excluding OpenAI’s contractual commitments begins decelerating meaningfully, or if OpenAI’s equity-method losses resume worsening without a new restructuring in Microsoft’s favor, the investment case deserves reassessment — regardless of where the stock is trading at the time. As long as the thesis holds, further weakness is an opportunity to add, not a signal to reconsider.
On the exit side, the central-case scorecard above — a PE around 30x on continued 20% EPS growth — is the closest thing to a defined target this analysis produces, without being a fixed price commitment. The honest answer is that the precise exit discipline (a specific multiple, a return threshold, or a combination of both) will depend on how the thesis evolves over the coming quarters, and particularly on how the OpenAI financing question resolves. What’s fixed is the criterion for reassessment described above; what remains open is the criterion for taking profits once the re-rating, if it happens, is underway.
Correlation
This position adds limited diversification at the factor level. Alphabet, already held in the portfolio, shares the same underlying exposure — hyperscaler capital expenditure, AI monetization timing, and sensitivity to the same sector-wide sentiment swings discussed throughout this article. Both stocks fell and would likely recover together on the same catalysts. The case for Microsoft here is not that it diversifies away from that exposure, but that it offers a better entry price on it: Alphabet trades close to its own historical average multiple, while Microsoft trades at the bottom of its ten-year range. This is a reallocation within a factor, not a rotation across factors.
Currency
Microsoft is dollar-denominated, with no natural currency hedge embedded in the business structure comparable to a foreign-currency debt offset. Currency exposure here is real and unmitigated at the position level.
Defensive / offensive
The position sits between the two. The downside case rests on a defensive foundation — Windows, Office, and Azure outside its OpenAI exposure remain fully verifiable and intact even in the bear scenario, with a balance sheet carrying more cash than debt. The upside case is more offensive in nature, requiring continued execution on an AI capital expenditure cycle whose full return is not yet visible in the numbers. The position is being sized accordingly: large enough to matter if the offensive case plays out, small enough that the defensive floor is what determines the outcome if it doesn’t.
Conclusion
Microsoft is not a broken business. It is a business where the market’s confidence in one specific, bounded relationship has not kept pace with everything else the company has demonstrated.
The core — Windows, Office, Azure outside its OpenAI exposure, a balance sheet with more cash than debt, operating margins that have expanded in every year shown in this analysis — is fully intact and independently verifiable. The part of the thesis that isn’t independently verifiable is narrow and identifiable: the financing trajectory of a single partner whose audited financial statements don’t yet exist.
EPS has compounded at roughly 18-20% a year. The stock has compounded more slowly. That gap closed the multiple to its lowest level in a decade, alongside Alphabet and Amazon — both of which corroborate, with their own numbers, that AI capital expenditure across the sector is being met by demand rather than outrunning it.
I don’t know when the OpenAI financing question resolves, or in which direction. What I know is that the price being asked today does not require it to resolve favorably — only for it not to be a catastrophe. That distinction is the entire trade.
Image credits
Financial charts sourced from Fiscal.ai.
Important Disclosure & Disclaimer
All content published by JB Peter on this platform is strictly for educational and informational purposes. It does not constitute investment, financial, legal, or tax advice, nor does it represent a personal recommendation or solicitation to buy or sell securities. This research is operated by ORIACON (SASU) and reflects independent corporate analysis. Every reader must conduct their own independent research (Due Diligence) or consult a licensed professional before making any financial decision, as financial markets involve a high risk of capital loss. At the time of writing, ORIACON or the author HOLD shares in the company analyzed in this article. Following this publication, ORIACON and the author reserve the right to buy, sell, or modify positions in any security mentioned at any time, without prior notice to readers or subscribers.