
The objective of this Investing 101 series is to give you the basics on how to invest. This is the second of three articles on how to analyze a stock.
This article was originally a single piece, but given its length, I decided to split it into three parts to make it easier to read and more educational.
The three articles will follow the format I use in my deep dives.
This first one considered a business review.
This article will cover the financial aspects, management analysis, and capital allocation
Followed in the third part by an outlook based on bullish and bearish arguments and the company’s valuation.
Here are the two first articles in case you missed it:
Investing 101 - Getting started before you buy anything

This is the first article in a series on getting started with stock market investing. The goal here is to cover the basics you need to know before you start investing. The next articles will cover “choosing my first ETF,” then “choosing my first individual stocks,” followed by sections on creating a watchlist and putting together a checklist.
Investing 101 Part 2 — Choosing Your First ETF

The objective of this Investing 101 series is to give you the basics on how to invest.
So we’ll wrap up our overview of the company—as a starting point—before moving on to the outlook in the next article.
Analyzing financial statements is, on the one hand, very straightforward, as one can focus on a few key indicators and obtain initial results that are both robust and compelling. This is also the area where finance professionals have the most data readily available and the greatest ability to interpret it using relevant analytical frameworks.
Gaining an advantage over them in this area is very complex and requires in-depth work.
In a future article, I’ll discuss how, despite the excellent candidates who choose a career in finance, individual investors have undeniable advantages. Stay tuned.
One of the key advantages of investing in the stock market is the equal access to information shared with all market participants—namely, public information. To form your own opinion about a company, you have access to the same documents at virtually the same time, and insiders who possess an informational advantage are required to disclose their stock purchases and sales. You’re therefore on a level playing field with other investors and can buy and sell shares in some of the world’s best companies, often for less than $1,000, with trading available nearly 40 hours a week.
So the battle is being fought in the financial documents, which we’ll look at right now.
The three financial statements
Any company listed on an index must follow a number of disclosure rules specific to its listing. In the United States, companies typically publish an annual report called a 10-K and quarterly reports called 10-Qs, which are available on the SEC’s website (the U.S. securities regulator) or on the companies’ own websites (under the “Investor Relations” section). In addition, companies hold earnings calls—presentations of their results that include a question-and-answer session with analysts—and transcripts of these calls are typically made available afterward.
For the rest of the world, the principle is generally the same. Keep in mind that some companies publish their results only in their own language, which makes them difficult for international investors to understand, or they publish their results on a semi-annual basis. This means that any bad news arrives several months later, which amplifies the market reaction, especially given the long-term outlook.
The three financial statements are the income statement, the balance sheet, and the cash flow statement. Accounting standards exist; the main ones are Generally Accepted Accounting Principles (GAAP) in the U.S. and International Financial Reporting Standards (IFRS) in the rest of the world. IFRS is based on GAAP, with some differences between the two.
I’m keeping this brief on purpose; there’s a lot to say about these topics—enough to fill years of study.
The Income Statement
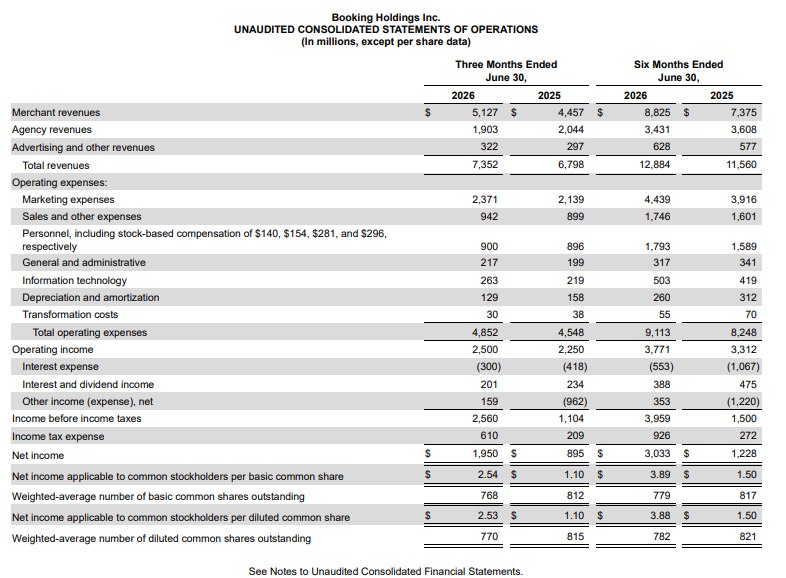
The income statement is a report that shows how the company generated profit from its operations over a given period. It all starts with revenue, from which costs are subtracted to arrive at operating income—a numerical measure that indicates the extent to which the company is generating profit from its operations. After deducting financial and extraordinary items, we arrive at net income, which measures the amount of money available to shareholders.
The key items to look at are:
Revenue
Gross Margin and Operating Margin
Net margin (if I have $1 in revenue, how much profit do I make?)
Financial and Non-Recurring Items
Net income
Here is an example from Booking’s 10-Q for the period ending June 30, 2026.
Depending on the business, some companies handle very high volumes with very low margins (e.g., retailers like Walmart or Aldi), while others handle low volumes with high margins (e.g., service or luxury companies). It all depends on the industry and the company’s competitive advantage. It doesn’t make sense to compare different industries directly.
Generally speaking, investors view an increase in margins as a sign of a stronger competitive advantage—and therefore as excellent news. This remains a general rule; the specifics should be examined on a case-by-case basis, depending on the context.
The Balance sheet
If the income statement is a movie, the balance sheet is a snapshot. It shows the company’s assets (and net worth) and how they are financed. The sharpest minds will have noticed that the balance sheet is… balanced: assets always equal liabilities.
A distinction is made between assets (items to be financed) and liabilities, which represent the source of financing.
These assets and liabilities can also be either current—with a useful life of less than one year—or noncurrent—with a useful life of more than one year.
This leaves us with four line items on the balance sheet, as shown in the image below:
The key components are primarily found in the fixed assets. Peter Lynch, the famous investor, has said that he considers current assets to balance each other out, so that only the fixed assets need be considered—whether purists like it or not.
Here is an example from Booking’s 10-Q for the period ending June 30, 2026.
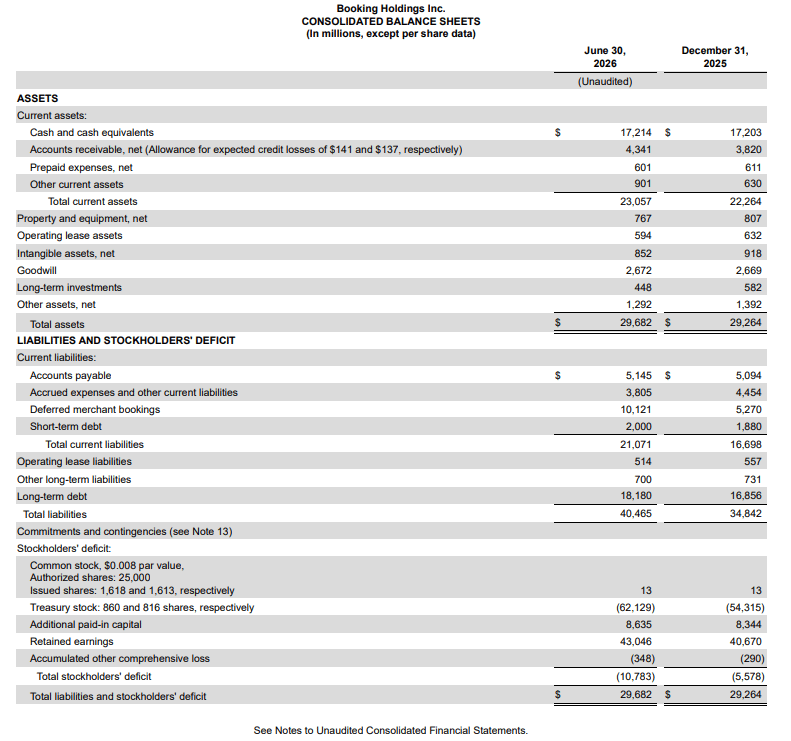
The key items to look at are:
Inventory levels
Cash and cash equivalents
The ratio of long-term debt to equity
The number of shares
But if I had to choose just one, it would be the debt-to-equity ratio (= (long-term debt - cash and cash equivalents) / shareholders’ equity).
Peter Lynch also noted that a healthy debt-to-equity ratio could be as high as 50 percent. Beyond that, in the event of an economic downturn, the company would be exposed to a spiral of debt that could lead to bankruptcy or the dilution of existing shareholders.
You’ll notice that in the example, Booking has negative equity. This is the result of share buybacks carried out year after year. It’s not a problem—neither from an accounting nor a business perspective—and sometimes occurs among large-cap companies that have conducted a significant number of share buybacks.
Another key factor is the change in the number of shares. Most Quality companies will buy back shares, either to reduce the number of shares outstanding or to pay a dividend. Share buybacks offer several advantages:
It is a sign of confidence in the future of management
Fewer shares can cause the price to rise more easily (or fall). In 2021, Xavier Gabaix (Harvard) and Ralph Koijen (University of Chicago) published “In Search of the Origins of Financial Fluctuations : The Inelastic Markets Hypothesis” — one of the most consequential papers in modern finance. Their central finding : financial markets are far less elastic than classical theory assumes. In equity markets, $1 of net inflow moves total market capitalisation by approximately $5.
The tax treatment of share buybacks (capital gains) is generally more favorable than that of dividends. And as long as you don’t sell, there is no tax.
Growth companies have much greater capital needs and typically issue new shares, a process known as dilution. If you’re diluted by 4%, that amounts to a 4% loss on your investment. However, these new funds will enable the company to grow—presumably by more than the amount of that dilution. This is a very strong implicit assumption in growth investing. It isn’t necessarily a bad calculation for the best companies, but dilution raises the bar that your investment must clear to achieve the expected return.
The Cash Flow Statement
This last document is very interesting because it shows us where the cash is going. The table starts with net income and breaks down cash flow into three categories:
Operational Workflows
Investment Flows
Funding Flows
Similarly, here is another example from Booking in its 10-Q for the period ending June 30, 2026.
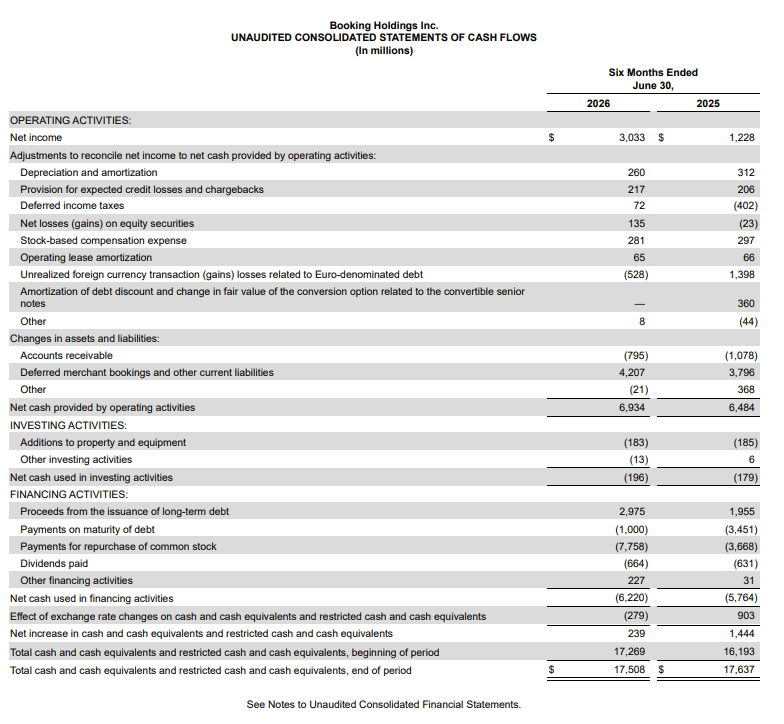
The key items to look at are:
What is the difference between free cash flow (FCF) and net income?
How many years of operating income would it take to pay off the debt?
How many share buybacks or dividends are made?
What are the amounts of stock-based compensation?
Based on the data in the financial statements, we calculate an extremely useful metric: free cash flow (FCF). It is calculated by subtracting capital expenditures (CapEx) from operating cash flow (Cash Flow from Operations).
It answers the question: “How much cash is actually left in the coffers to pay off the debt or pay dividends?”
FCF is a more accurate measure of a company’s ability to create value, unlike net income, which can be manipulated more easily through accounting.
It is necessary to identify the differences between the two.
Just as in a police investigation, reading one of the documents provides information, but it is only by cross-referencing all three documents that one can form a comprehensive picture of the financial situation. This statement can, in fact, be extended to our entire study of quantitative and qualitative factors.
All three documents contain numerous footnotes explaining how the data is calculated in cases where questions about accounting treatment may arise. They often include all sorts of subtleties intended to make the situation appear more favorable. The devil is in the details—in this case, the accounting details.
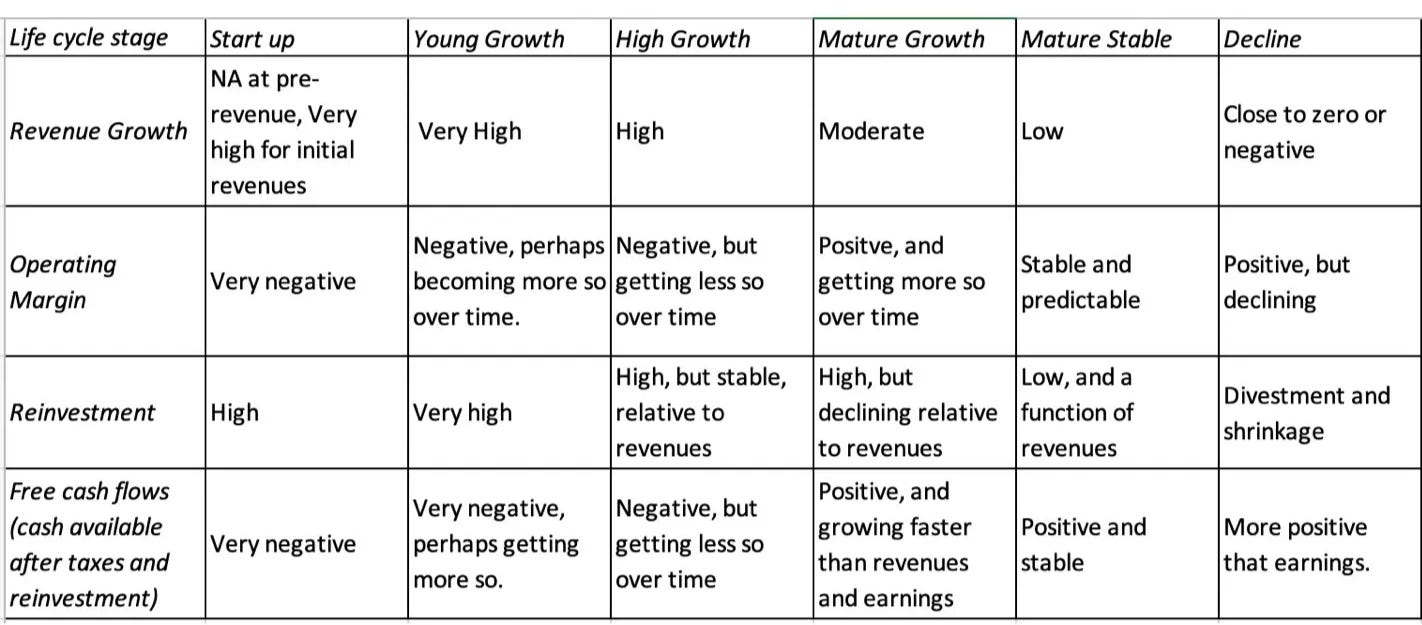
We mentioned Aswath Damodaran in the previous episode. Here is an overview of the key financial items and expected behavior based on the company’s life cycle for the three types of cash flows.
Profitability Ratios
Growth indicators are fairly straightforward: simply compare growth with recent fiscal years, focusing primarily on revenue, margins, and profit (FCF and net income). Profitability indicators are a bit more complex and warrant your attention when cross-referencing the data. In fact, market concerns often center on these points. Therefore, the ability to interpret these figures is essential.
Investment
Here is a non-exhaustive list of profitability metrics, starting with my favorite, ROIC.
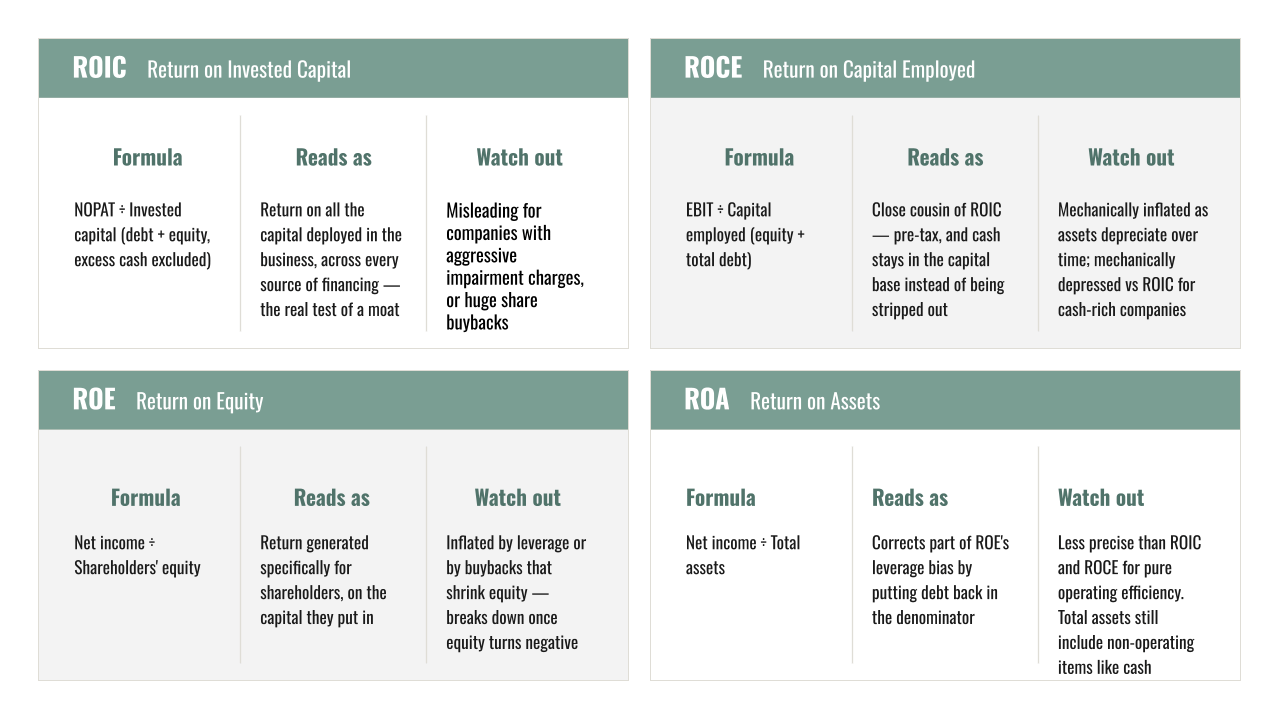
ROIC (return on invested capital) :
Formula: NOPAT (operating income after taxes) / invested capital (debt + equity, excluding excess cash)
Purpose: It measures the return generated on the capital actually invested in the business—including debt and equity—but not cash.
Meaning: If a company invests $1 through debt or equity, with a ROIC of 20%, its investment generates $0.20 in operating income after taxes (as long as the ROIC remains at that level). A ROIC higher than the WACC (weighted average cost of capital) is profitable.
Comments: ROIC can be misleading for companies that engage in aggressive asset write-downs or share buybacks.
There is also a variant called ROCE.
ROCE (return on capital employed)
Formula: EBIT (operating income before tax) / capital employed (equity + total debt). This includes any excess cash.
Purpose: It measures the return generated for each euro of capital used.
Meaning: If a company invests $1 in capital (debt + equity), with a ROCE of 20%, it generates $0.20 in operating income before taxes (as long as the ROCE remains at that level).
Comments: Does not take into account non-operating cash flows (such as inventory value, which is important for oil and mining companies). Asset impairments automatically push ROCE higher. Misleading for companies with large amounts of cash.
ROE (return on equity) :
Formula: net income / shareholders’ equity
Purpose: Measures the return generated for the shareholder on the capital they have contributed,
Meaning: If a shareholder invests $1, with a ROE of 20%, this generates €0.2 in profit for the company.
Comments: It may be artificially inflated by high leverage or by low equity (aggressive—or even negative—share buybacks).
These three indicators should be analyzed in conjunction to assess the quality of the business and its management. It is helpful to compare these three metrics for the company with those of its competitors. Note that this is more difficult for companies with several completely different business lines, such as Amazon, which combines retail operations with data center operations.
There’s also ROA, which I don’t use very often:
ROA (Return on Assets) :
Formula: net income / total assets
Purpose: Partially corrects the bias in ROE by including debt in the denominator—less sensitive to leverage, more appropriate for comparing companies with different capital structures
Meaning: If the company generates $0.20 in net income for every $1 of total assets, its ROA is 20%.
Comments: This metric is less precise than ROIC/ROCE when measuring pure operational efficiency, since total assets also include non-operating assets (cash, equity investments) that ROIC specifically excludes. Furthermore, net income needs to be examined to determine whether it provides an accurate picture of reality.
Here is a summary of the four indicators:
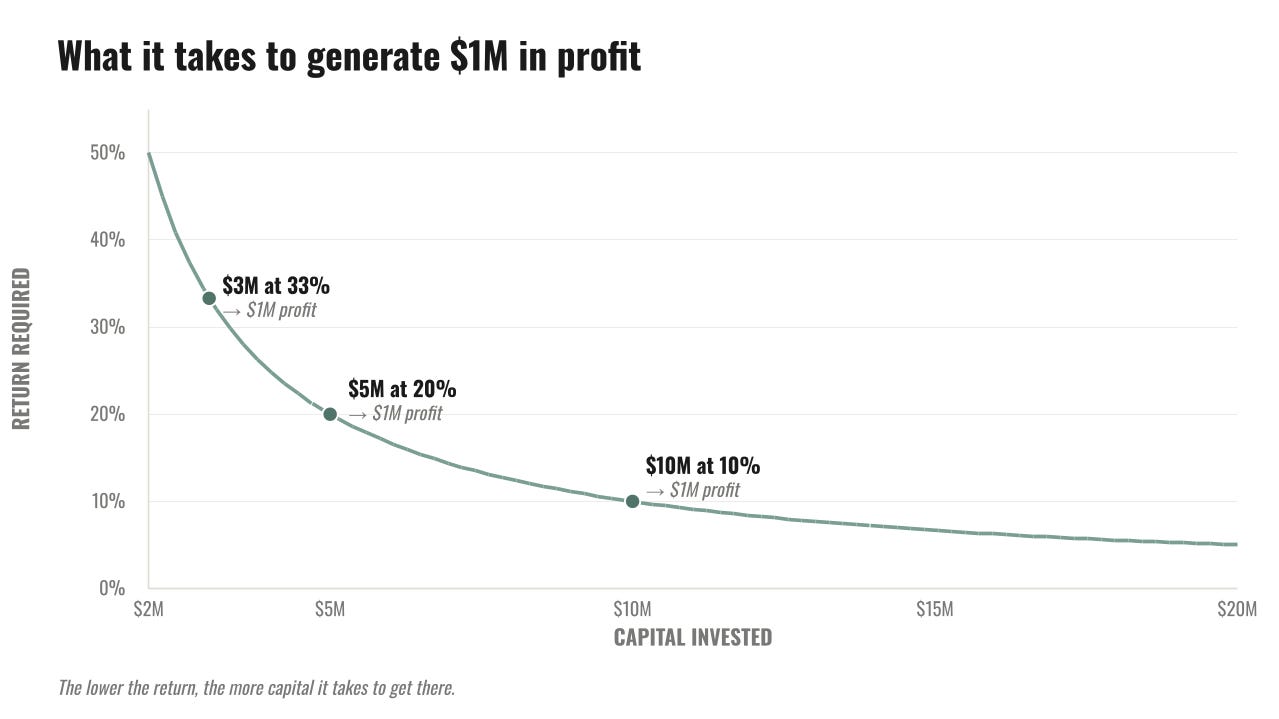
Also note that it is necessary to evaluate investment opportunities and weigh them against profitability: To generate $1 million (in NOPAT), for example, one could:
Invest $10 million at 10%,
Invest $5 million at 20%,
Invest $3 million at a 33% rate.
A company will be able to continue investing as long as its resources allow, depending on its market and the creativity of its management.
Net Margins
There are two key indicators for margins.
Net margin:
Formula: net income / revenue
Profit: what actually remains for shareholders from every dollar of revenue, after all expenses have been deducted,
Meaning: If the company generates $1 in revenue with a net margin of 20%, $0.20 in net income remains for shareholders (as long as the net margin remains at that level),
Notes: Distortion may occur if the company has subsidiaries in which it owns between 50% and 100% of the shares—in which case, minority interest must be adjusted.
FCF margin :
Formula: free cash flow / revenue
Usefulness: How much of every dollar in revenue actually remains as cash after capex is deducted,
Meaning: If the company generates $1 in revenue with a 20% FCF margin, it converts $0.2 of that revenue into actual available cash (as long as the FCF margin remains at that level),
Notes: There may be some distortions, particularly if a company sells subscription-based services: only the portion that has already been completed and billed is recognized, not the entire plan.
It is important to compare and analyze the differences between net income and free cash flow—and thus between their margins. This is a useful exercise to perform during your analysis to gain a thorough understanding of specific accounting practices.
A few other metrics that I don’t use:
EBITDA: Earnings Before Interest, Taxes, Depreciation, and Amortization. This metric omits too many important factors to provide an accurate picture of the business’s profitability. Charlie Munger had a famous remark on this subject:
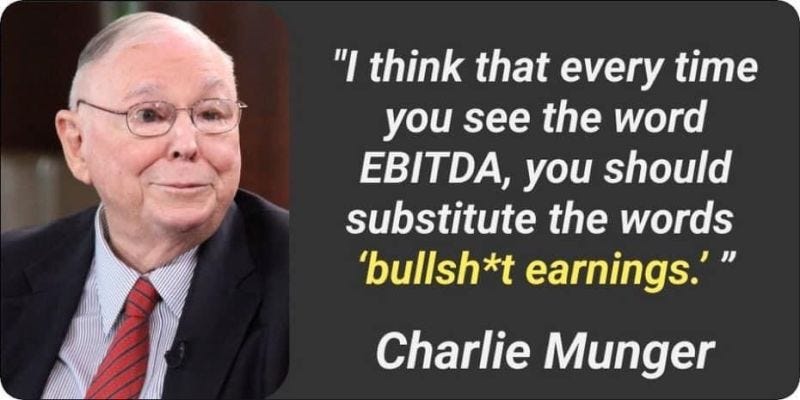
Worse still, some companies prefer to report adjusted EBITDA.
A word of advice: Use the figures reported in accordance with accounting standards as your point of reference. Generally, those who present you with adjusted or non-GAAP figures do so to paint a rosier picture of reality—in other words, to make a sales pitch—rather than to tell the truth.
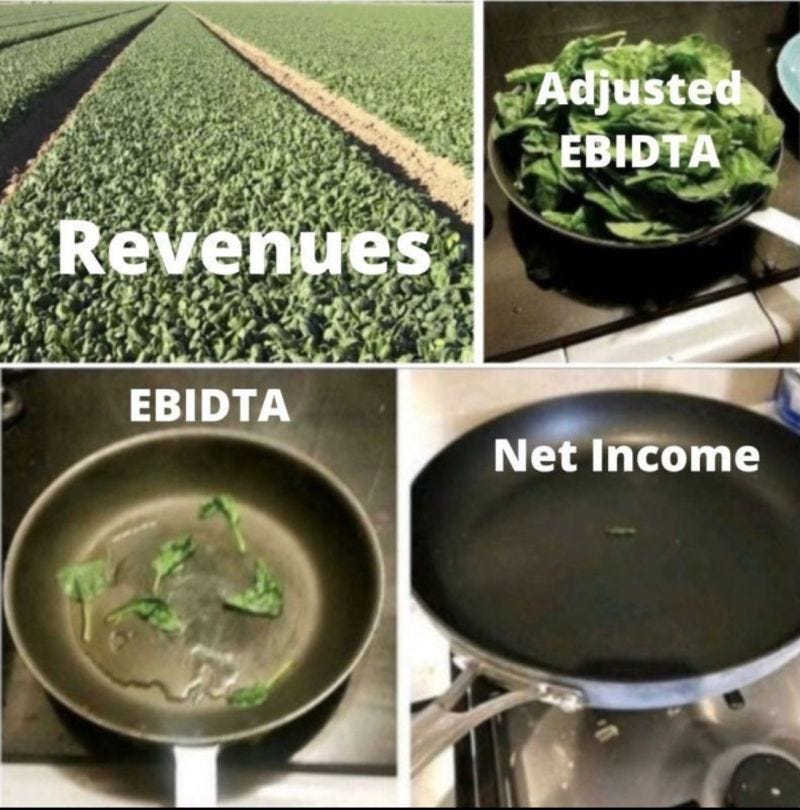
Every rule has its exception: I recently saw a presentation of results from Novo Nordisk that showed sales figures adjusted for two factors: one was a reversal of an accounting provision (a valid reason), and the other was due to an impairment charge related to discontinued drugs (a debatable reason). I’ll leave you with the image below, which pretty much sums up my opinion on the matter:
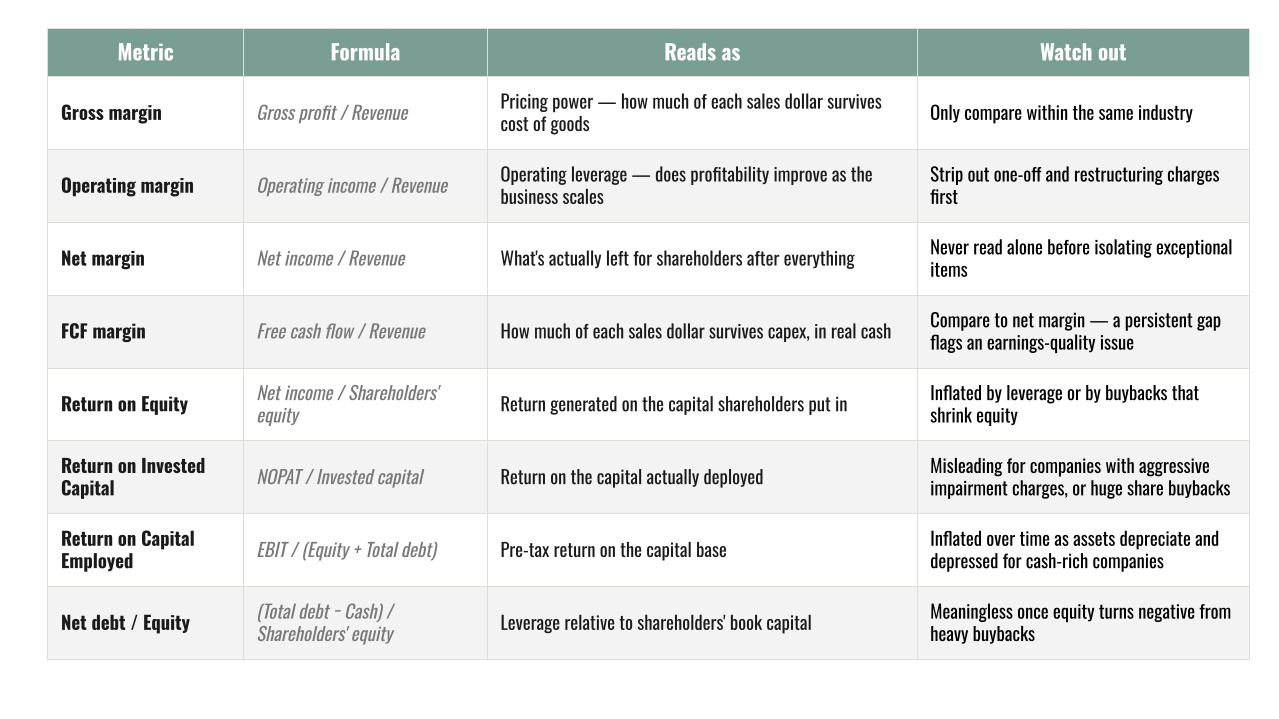
Here is a summary of the key profitability metrics:
3. Management
There is a fundamental problem between shareholders and managers: the manager seeks to line his own pockets with shareholders’ money instead of acting as a good steward. This has been theorized by several well-known authors.
The renowned Adam Smith had already pointed out in *The Wealth of Nations*:
The directors of such companies, being the managers rather of other people’s money than of their own, it cannot well be expected that they should watch over it with the same anxious vigilance with which the partners in a private copartnery frequently watch over their own.
In 1976, a seminal article by Michael Jensen and William Meckling (“Theory of the Firm: Managerial Behavior, Agency Costs, and Ownership Structure,” Journal of Financial Economics) defined agency theory, a famous milestone in the history of management.
They define the agency relationship as a contract under which the principal (the shareholder) delegates decision-making authority to an agent (the manager), and argue that if both parties seek to maximize their own utility, there are good reasons to believe that the agent will not always act in the principal’s best interest. It was this article that gave rise to the term “agency costs”—the cost of this conflict of interest.
The goal of this entire section will therefore be to answer the following questions:
Who are these managers?
Are they effective?
Can I trust them with my money?
The order of the questions is designed for educational purposes. When analyzing actions, you will inevitably ask yourself all three questions at the same time.
To assess the management team, simply asking your favorite AI a question, reviewing the financial documents, and taking a look at LinkedIn should provide you with all the information you need.
Management Effectiveness
Based on my studies in management and my experience as a project management professional, the theoretical definition of a good manager is based on performance indicators and their ability to meet them. It is very difficult to distinguish a good manager from a favorable situation. This point is essential: a good manager is often considered as such because they are successful.
The challenge here will be to distinguish between economic conditions and the manager’s performance.
One way to do this is to examine the track record—that is, actual performance versus promises—and thus compare the set goals with the actual results using the financial statements from recent fiscal years.
The renowned Warren Buffett wrote in his 1979 letter to shareholders:
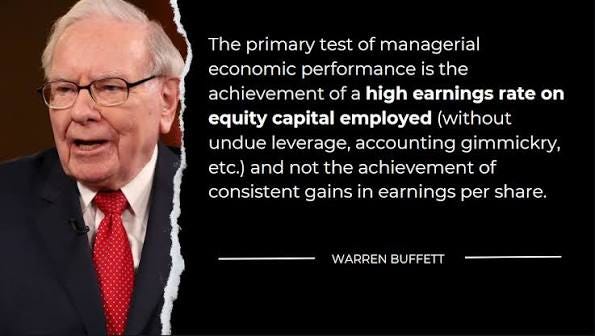
You’ll notice the characteristic AI style of “it’s A, not B”—nearly 50 years ahead of its time. A pioneer.
In practical terms, this quote means that you can significantly increase your profits by investing heavily, even with a low rate of return. It’s like saying that to double your savings, you can either double your existing capital through your investments or contribute the same amount from your savings.
True management competence is measured by the return on capital already invested.
Ideally, then, you’ll want: excellent management capable of generating very strong returns on invested capital, along with the reinvestment opportunities inherent in the business. Ideally, you’ll want plenty of both if you’re taking a long-term view.
Its management ability is measured by capital allocation, which varies depending on the stage of the life cycle:
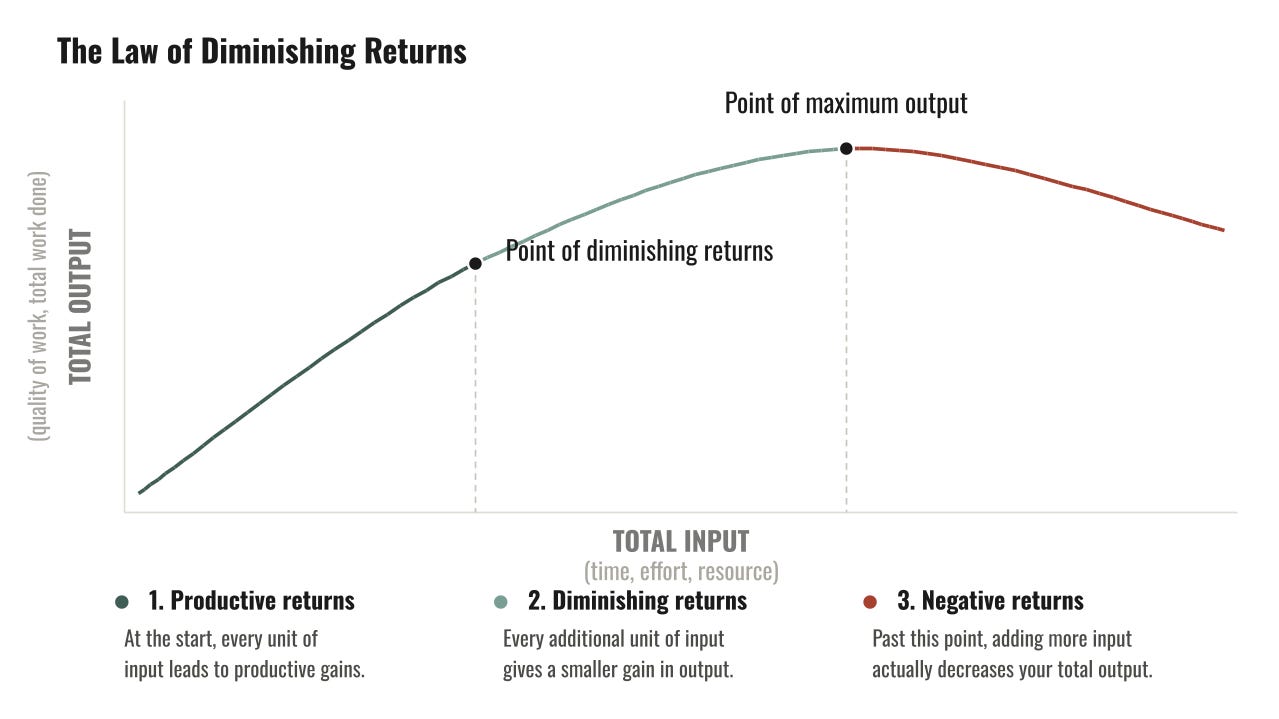
First and foremost, a company will finance its organic growth through items such as capital expenditures, R&D, and working capital needs. This is the best use of capital as long as the return on that reinvestment exceeds the cost of capital. As the company grows, these opportunities diminish over time. In economics, this is known as the law of diminishing returns.
If there is capital remaining beyond what organic growth can absorb at a good rate of return, three options are available: external growth (M&A), dividends, or share buybacks. Be careful, though: external growth is generally a bad bet for shareholders. Personally, I prefer to avoid share buybacks, which are often based on overly optimistic assumptions and coincide with market highs.
Management is expected to return to shareholders any funds that cannot be invested with a sufficient rate of return.
If you invest in dividend-paying companies, check their ability to pay dividends during difficult times (COVID-19 in 2020, the Global Financial Crisis in 2008, etc.).
Also keep in mind that, in a young company, good management is the source of competitive advantage, and that advantage will grow over time. Poor management—or management grappling with structural challenges in its business—will see its competitive moat erode and, consequently, its profitability decline.
Trust
The best way to earn management’s trust is to make sure your interests are aligned with theirs.
Nassim Nicholas Taleb in his 2018 book, Skin in the Game: Hidden Asymmetries in Daily Life, describes a concept that has since been widely cited: “Skin in the Game.”
If the manager holds a significant—or even a majority—stake in the company where you’ve invested, your interests are aligned because he shares your goal: to drive up the stock price and thereby maximize your wealth.
We will therefore prioritize seeking out founding executives, who have the advantage of holding a significant stake in the company and possessing a long-term vision. The superior performance of owner-operators has been proven over the long term, due to the natural selection that occurs over time between founders who are excellent managers and those who stagnate or go bankrupt.
When it comes to CEOs who are not founders, it is important to review their compensation plan in particular: Is it in cash? In stock? What performance goals is it tied to?
By choosing a founder who runs the company, you stack the odds in your favor, but it doesn’t guarantee success. I experienced this firsthand as a counterexample when I invested in a promising Italian consulting firm. For several reasons, I sold my position two years ago, one month before the bombshell in September 2024: The press reported that the founder and CEO of Digital Value, Massimo Rossi—founder, CEO, and largest shareholder of Digital Value (an Italian IT company listed on the Milan Stock Exchange)—was arrested on October 16, 2024, for corruption and rigging public bids in the Sogei case (the IT company of the Italian Ministry of Economy). He resigned that same day, and the stock price plummeted during the trading session. In less than a month, the stock plummeted by 80%. It was delisted a few months ago.
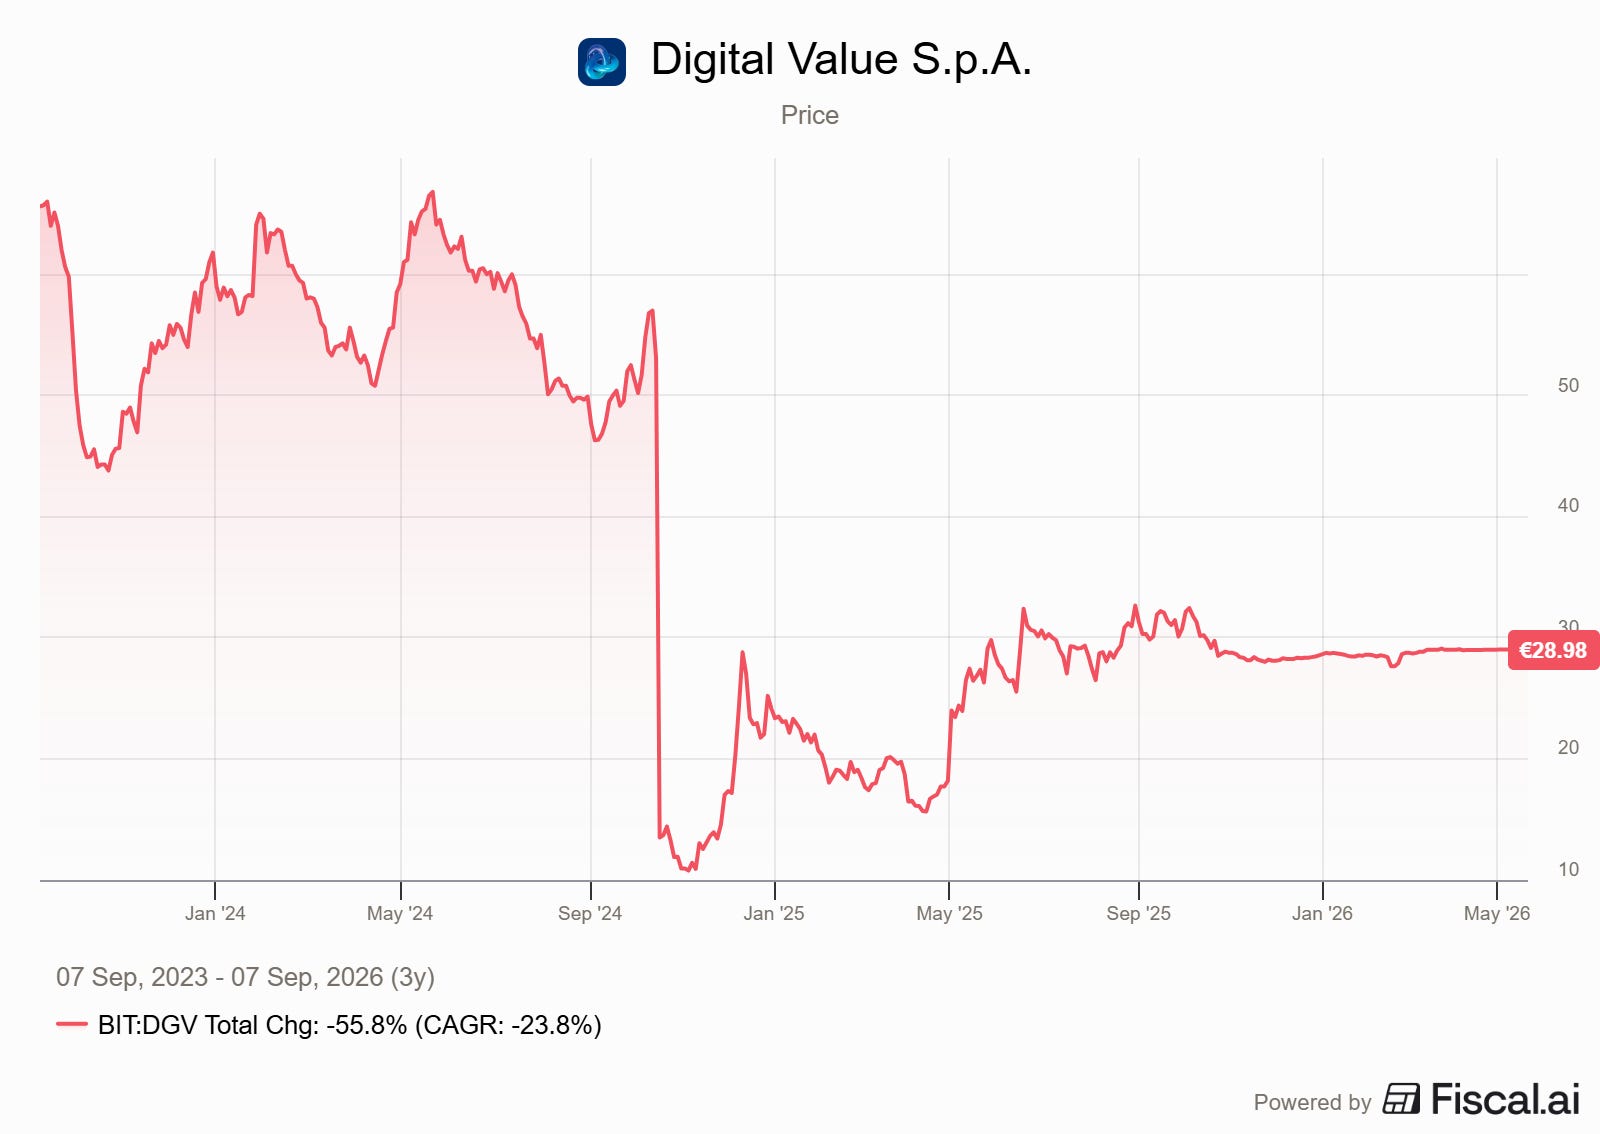
The executive had previously been praised for his management skills and vision. This is just one example among many of the risks associated with portfolio concentration and what is known as company-specific risk.
Furthermore, a good place to assess management’s integrity is in the financial statements. I’ve previously discussed metrics that are adjusted to paint a rosier picture than usual, but management under pressure to deliver good numbers may be tempted to shift their perspective. To name a few examples, I’m thinking of recurring non-GAAP restatements from one quarter to the next, changes in accounting estimates (depreciation periods, provisions), aggressive revenue recognition, and “exceptional” expenses that occur too frequently to be truly exceptional.
The devil is in the details—in this case, accounting details.
Final thoughts
This section concludes the static analysis of the company and helps address some initial questions regarding the quality of the business and your desire to keep it in your portfolio.
The “Financials” section should allow you to cross-reference the information from the “Business” section, particularly with regard to competitive advantage. Management will indicate the quality of management: good management will strengthen its competitive advantage whenever possible. It is therefore an essential prerequisite for investment and the source of numerous risks.
The next step will be to look ahead, considering both bullish and bearish scenarios, and to estimate a target price based on the company’s possible futures.
Disclaimer: This content is for educational purposes only and does not constitute investment advice — see our full disclaimer.