
The objective of this Investing 101 series is to give you the basics on how to invest. This is the last of three articles on how to analyze a stock.
This article was originally a single piece, but given its length, I decided to split it into three parts to make it easier to read and more educational.
The three articles will follow the format I use in my deep dives.
This first one considered a business review.
The second article covered the financial aspects, management analysis, and capital allocation
Followed in the third part by an outlook based on bullish and bearish arguments and the company’s valuation.
Here are the two first articles in case you missed it:
Investing 101 - Getting started before you buy anything
Investing 101 Part 2 — Choosing Your First ETF
1. The Two Theses
The goal of this section is to present the facts on both the upside and downside possibilities. This is meant to guard against two well-known pitfalls:
Only considering the upside is wishful thinking, which can cost you dearly in monetary terms.
Only considering the downside is catastrophizing, which can cost you dearly in terms of regret.
Having solid projections about the future will make it much easier to hold positions psychologically, because you’ll always have a rational anchor with arguments to support you or guide your decisions. Doing nothing is also a decision.
Note that if you don’t have the facts to answer the questions below, your investment thesis isn’t solid, and you’re better off moving on and investing in another company or another sector.
The same works for a stock that has risen sharply — in that case, it’s the reverse:
Results above expectations
Guidance raised
Macroeconomic factors
Company-specific catalysts: an influential investor taking a stake, a major contract signing, a technological breakthrough
Next, we look at the bear thesis. It generally builds on the “why did the stock drop” elements, going one level deeper:
Loss of market share to competitors.
Operating margins under pressure (rising costs, falling selling prices).
Excessive debt levels or insufficient cash (cash burn).
An outdated or disrupted business model.
Management changed strategy, and products no longer sell because they no longer address the right needs.
Is this a structural problem or a conjunctural one?
In light of this, we must ask ourselves what evidence supports these fears, and whether they are substantiated:
Analysis of financial statements (balance sheet, income statement),
sector reports,
Comparison with peers.
Supplier and Customer Analysis
To take this line of thinking all the way through, ask yourself the following questions: What if the bear thesis is really true? What does that mean?
The idea is to quantify the impacts described above.
At the end of your argument, you should be able to identify clear criteria that allow you to conclude that the bearish thesis is valid. For example:
Revenue growth of X% or less
Margins under Y%
Competitors’ market share exceeds Z%
Generally speaking, some of the arguments raised are true, but the company will be able to address them easily. Then put yourself in management’s shoes and ask yourself what options they have to remedy the situation. That is the whole point of the bullish thesis.
What specific actions could management take? They can generally:
Launching new products or changing strategy,
Start a price war (very bad in the short term),
Take over a troublesome competitor,
Focus on its core business by selling or divesting segments,
Reduce costs.
Next, check management’s actions and communication
Is management transparent about the difficulties and credible in its solutions? Does management hit its targets from one report to the next? Are they too optimistic?
What actions has management planned to take? Every action in the plan should improve the fundamentals and restore investor confidence.
As with the bear thesis, you should be able to identify indicators that confirm the bull thesis. For example:
Revenue growth above X%
Margins above Y%
The company’s market share above Z%
These actions need to produce concrete results that address the difficulties. So we look for catalysts, which are specific events that trigger a significant movement in a stock’s price, or in the market as a whole.
They come in several types:
Performance catalysts: the company beats expectations.
Market catalysts:
-Index inclusion: which forces thousands of ETFs to now buy the stock.
-Coverage initiation: when an analyst revises their target price
-Short squeeze: an upward market move, or a move above a certain threshold, can force short sellers to urgently buy back their position.
Strategic catalysts:
Buyout or merger: an acquisition offer from a major player.
Spin-off: separating a business division to reveal the hidden value of a subsidiary, which then gets sold by funds and ETFs whose underlying holding, however interesting, no longer fits their mandate.
Exclusive partnership: becoming the “preferred” supplier of a market leader.
4. Macroeconomic / regulatory catalysts:
Interest rate pivot: any change in interest rates, particularly US Treasury yields, changes the yardstick against which all investments are compared.
Changes in commodity prices.
The end of a recession, or a price change affecting customers’ budgets.
Regulatory framework changes.
The event happening is one thing, but remember that the market thinks in probabilities. The price adjusts toward the news as the catalyst becomes clearer and clearer — not at the moment it actually occurs.
I also note the blind spots in my research, so I can keep track of unresolved points that may have slipped through the analysis. It’s not possible to answer all of these questions exhaustively — otherwise investing would just be a matter of computing power. Investing requires acting on imperfect information: that means making a decision without knowing everything, but with enough information to act with a good level of confidence.
2. How much?
This section addresses the question of profitability, approached through two methods:
Valuation, which consists of determining the company’s intrinsic value from its own future cash flows, independently of what the market thinks.
Pricing, which consists of determining how much the market is willing to pay for those same flows, through a multiple.
I’m not a finance professor. So I’ll leave it up to you to decide if you’re interested in what Aswath Damodaran—who is one—has to say on the subject. He has plenty of free resources on his Substack, YouTube videos, and books that are excellent reads, particularly his book *The Little Book of Valuation*.
When it comes to valuation, the gold standard is the DCF method, which involves calculating a company’s future cash flows and discounting all of its future cash flows to the present to derive its intrinsic value. This value is independent of the market’s assessment of the company. It is, therefore, an intrinsic valuation method.
Personally, I believe that the information needed to accurately perform a DCF analysis (5- to 10-year growth rate, terminal value, discount rate) cannot be estimated with sufficient reliability for most companies. Having built plenty of projections as a project manager, most initial estimates turn out to be completely wrong — even more so the further out the date, or depending on the quality of your starting assumptions. And having made and seen estimates made, there’s a tendency to land on the number you wanted in the first place. The DCF creates an illusion of expertise based on mathematical and logical reasoning whose foundations are often uncertain.
For this model to be relevant, a suitable company must be predictable, which narrows the range of possibilities.
Pricing, on the other hand, involves valuing the company based on comparables. In this case, you believe that the market is generally reasonable but has misjudged a specific value. It is therefore a relative method, divided into equity multiples and firm multiples.
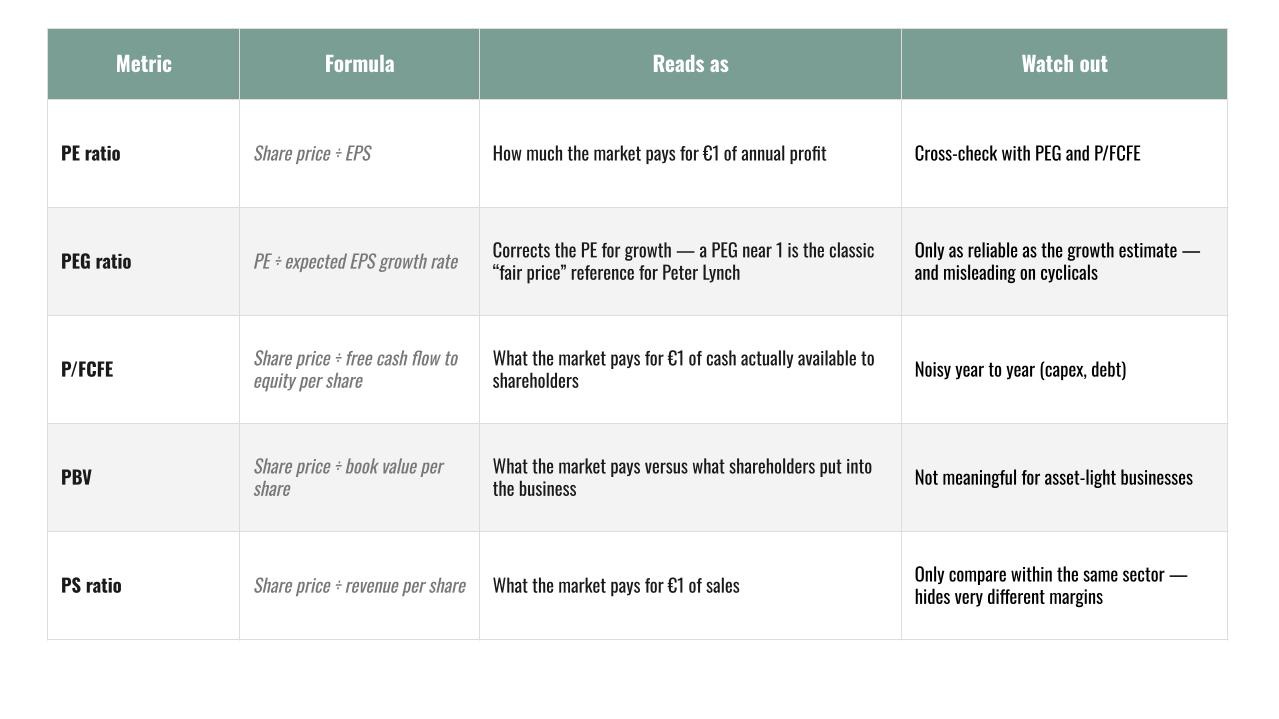
Equity multiples
PE ratio (price/earnings):
Formula: stock price divided by earnings per share —
Meaning: how much the market pays for one euro of annual profit. If a stock trades at 20 times earnings (a P/E of 20), you get back your money with the current earnings in 20 years.
Comments: depends heavily on the company’s growth and risk: you cannot say based on this unique metric that it is cheap or expensive. PE ratio Sensitive to the same accounting distortions as net income covered in the previous article (one-off items, minority interests). Best cross-checked against P/FCFE below, and the PEG ratio.
PEG ratio (PE to growth):
Formula: P/E divided by the expected earnings growth rate — corrects the raw P/E to compare different growth profiles.
Meaning: A P/E of 30 with 30% growth gives a PEG of 1; the same P/E of 30 with only 10% growth gives a PEG of 3. Peter Lynch said that a good PEG ratio is when the growth is equal to the PE (ex: 30% growth EPS with a PE of 30).
Comments: In the case of a cyclical company, the opposite is true. A company’s P/E ratio will drop at the end of a peak (due to investors’ expectations of a decline in the stock price) and will be extremely high at the trough of the cycle,
P/FCFE (price to free cash flow to equity):
Formula: share price divided by free cash flow to equity per share.
Meaning: how much the market pays for one euro of cash actually available to the shareholder.
Comments: In theory, FCF provides a clearer picture of the company. However, significant changes in investment or credit policies will skew the measurement. It should be compared with the P/E ratio.
PBV (price to book value):
Formula: share price divided by book value (equity) per share.
Meaning: how much the market pays relative to what shareholders have contributed or left in the company, on the balance sheet.
Comments: this was the signature formula of the famous investor Benjamin Graham. Since companies now have significant intangible assets (goodwill, brand, software), this key indicator of value investing is used much less frequently.
PS (price to sales):
Formula: share price divided by revenue per share.
Meaning: how much the market pays for one euro of sales —
Comments: the only one of the five ratios that still works even when the company isn’t yet profitable (young, fast-growing companies). Be careful to compare companies in the same sector, as the same revenue multiple can hide very different margins.
Firm multiples
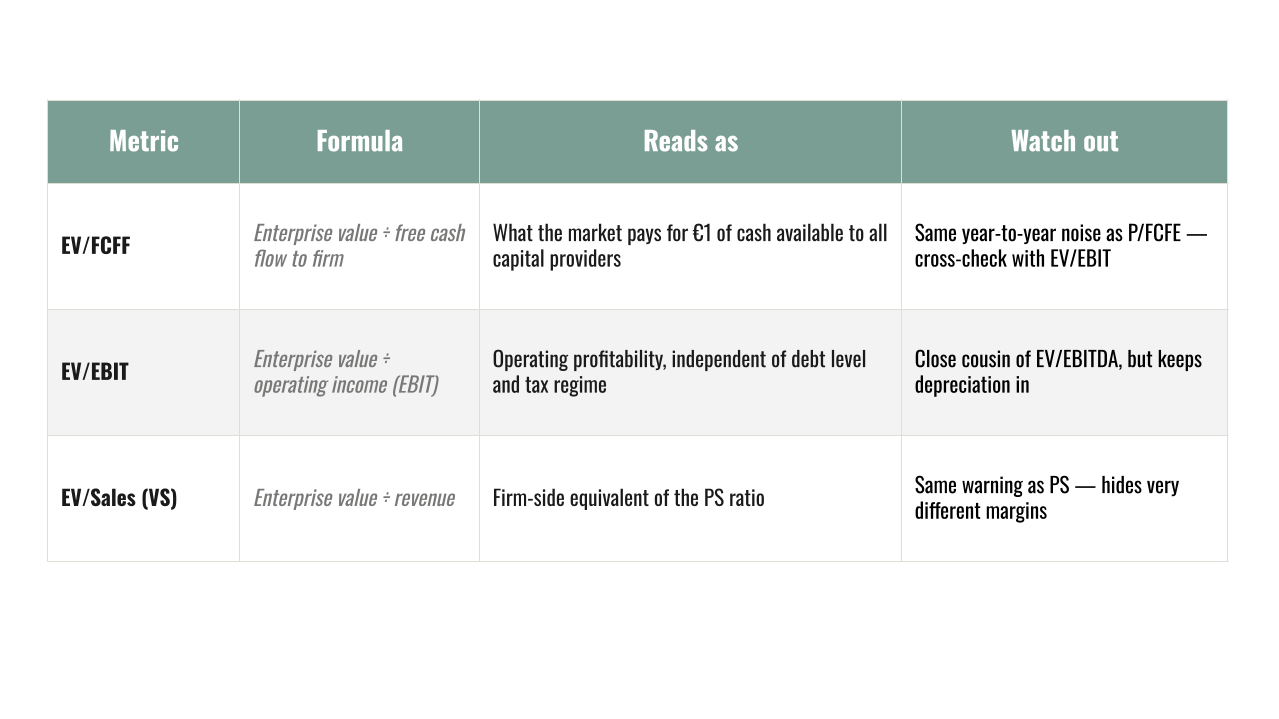
These take into account not just equity, but the full set of long-term resources available, namely equity and debt, minus net cash, to arrive at enterprise value. The advantage is being able to compare companies with different debt ratios by leveling this base.
EV/FCFF (value to free cash flow to firm)
Formula: enterprise value divided by the cash available to all capital providers (debt and equity), before any debt service.
Meaning: how much the market pays for one euro of cash generated by the company and available to all of its capital providers (shareholders and creditors), before any debt service.
Comments: In theory, FCF provides a clearer picture of the company. However, significant changes in investment or credit policies will skew the measurement. It should be compared with the P/E ratio.
EV/EBIT
Formula: enterprise value divided by operating income before interest and taxes
Meaning: measures operating profitability independently of the financing structure (debt vs. equity) and of each country’s tax treatment.
Comments: allows comparison of companies with very different debt levels without distorting the reading, unlike the PE ratio.
VS (value to sales)
Formula: enterprise value divided by revenue: it is the firm-side equivalent of PS.
Meaning: how much the market pays for €1 of sales.
Comments: it still works even when the company isn’t yet profitable (young, fast-growing companies). Be careful to compare companies in the same sector, as the same revenue multiple can hide very different margins.
We look for a gap between what the company is worth (as described in the two theses section) and the price we pay for it, with the multiples shown above.
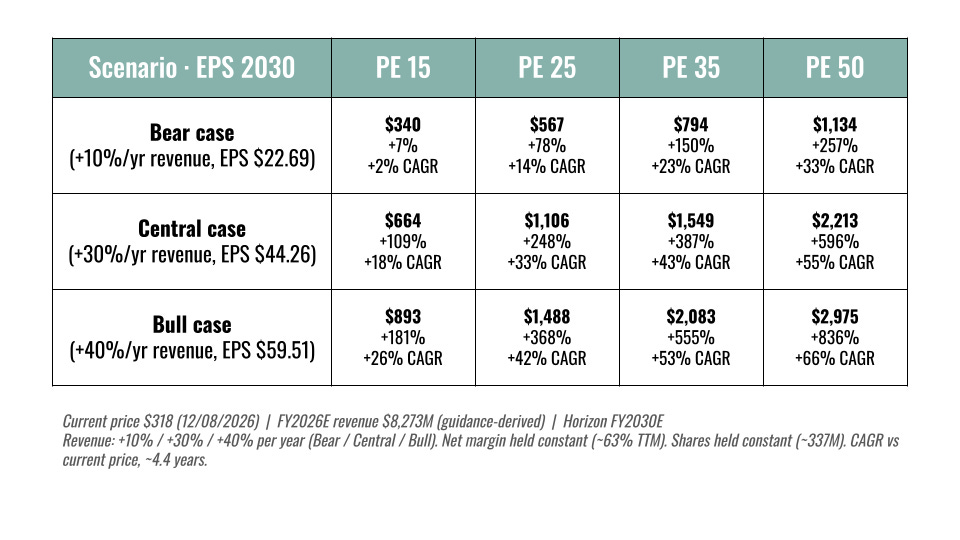
In practice, my method does not involve directly comparing a company to a basket of publicly traded competitors. I prefer to build a matrix of scenarios: estimating the company’s future earnings under various assumptions (bear/base/bull), then cross-referencing them with possible multiples. To make this simple and easy to understand for my readers, I use the P/E ratio after adjusting for non-recurring items.
The idea is to identify a range of possibilities using a pricing scorecard in this format. Then, based on the factors in the bull vs. bear analysis, to determine where my conviction lies.
The goal will be to monitor the company over time and verify that it is on track with my profitability assumptions.
Here’s an example I wrote in one of my articles as part of a deep dive into AppLovin.
So we’ll be looking for the valuation target a few years down the road, but in the short term, the stock price could react in an irrational way. I’ll break this down into two parts: fundamentals and investor sentiment.
The short-term volatility will prompt further reflection on investor sentiment, which will be the subject of another series of articles. For now, we are in the process of identifying three stocks as part of a pilot phase, as mentioned in the first article of the series.
That’s how I do my deep dives.
Ultimately, this is serious research that can take hours—or even days—of work. It’s the price you pay for an investment that you’ll be able to stick with over time, and that will help you avoid many mistakes and sleepless nights of doubt.
Final thoughts
In these three articles, we’ve seen the framework I use—and that I’m sharing with you—for selecting individual stocks. I develop investment cases whenever a stock seems like a great buy to me, based on a classification I outlined in another article. This method involves a detailed analysis, but this investment framework does not apply in every case. The next article will focus on how to identify companies on your own and how to screen them using an investment checklist to narrow down the field.
In addition, I invite you to check out the list of educational resources at the link below:

Disclaimer: This content is for educational purposes only and does not constitute investment advice — see our full disclaimer.
The habit that will save readers the most money is the one you state almost in passing: writing the bear and bull thresholds as numbers, margins under Y, market share above Z, before the outcome arrives, because a threshold set in advance cannot be quietly renegotiated by memory the way an impression can. Your DCF caution pairs naturally with that same discipline, since the model's weakness is not the arithmetic but that its inputs are chosen by the same person who wants a particular answer, which is exactly the bias pre-registered criteria protect against. And the line that the price adjusts as a catalyst becomes clearer, not when it occurs, answers the question every beginner eventually asks, which is why good news so often gets sold.