
A framework for trading inelastic assets — tested on oil, applied to Bitcoin
In August 2025, I bought OKEA ASA at 19 NOK, a Norwegian oil company.
The thesis was contrarian by nature. OKEA was in a temporary production trough — new wells under development, high capex, dividend suspended for several quarters. The market priced it as a broken story. It was a sequencing problem, not a structural one — and the stock was trading at a significant discount to intrinsic value as a result. The underlying asset, Brent crude, was sitting quietly around $70 a barrel. Inelastic by nature : supply takes years to adjust, demand moves faster, and when the two fall out of sync, prices don’t drift. They snap.
Then a president pressed a button.

In late February 2026, the US-Israel war against Iran broke out. Brent jumped from $72 to nearly $120 at its peak — one of the largest one-month oil price surges on record. OKEA, as a leveraged proxy on oil, amplified every point of that move mechanically.
I exited in two tranches at approximately 37-38 NOK. My signal was simple : ceasefire talks had begun, the geopolitical risk premium that had driven the move was tied to a condition that would eventually reverse. By early April, as de-escalation signals emerged, Brent had already dropped back below $100 — the war premium deflating as fast as it had built.
I made +110% in less than 9 months.
Not because I predicted a war. Because I understood the mechanism — a fundamentally undervalued proxy on an inelastic asset, where any external shock doesn’t produce a linear price move. It produces an explosion.
I am now applying the exact same logic. But to an asset whose supply is not constrained by drilling schedules, OPEC decisions, or geopolitical risk premiums.
It is constrained by design.
And no one — no president, no central bank, no government — can press a button to change that.
This article is structured in four parts : the supply mechanics of Bitcoin, the structure of Strategy Inc. as a leveraged proxy, the risks, and the exit discipline. Each part builds on the previous one. The thesis only makes sense if all four hold simultaneously.
The Short Version
Bitcoin has pulled back from its highs as sentiment swung from enthusiasm to fear — the pendulum Howard Marks describes, completing its arc. Meanwhile, the supply side has not moved. If anything, it has tightened : fewer coins on exchanges, more absorbed by ETFs, sovereigns, and corporate treasuries with no intention of selling. The available float shrinks with time, not with price. When risk appetite returns — and it always does — the same inelastic market that produced the last rally will produce the next one, amplified by a smaller float than before.
Strategy Inc. is the leveraged proxy on that dynamic. Its mNAV is at historic lows. Its Bitcoin per share is growing. The pendulum is at the fear end of its arc.
This is a fixed supply, variable sentiment trade. The supply side is decided. The sentiment side always comes back.
Part 1 — Bitcoin : The Most Inelastic Asset in the World
1.1 Supply : A Mathematical Constraint, Not a Physical One
Every commodity has a supply ceiling. For oil, it is defined by geology, capital expenditure cycles, and political decisions — all of which can be adjusted, accelerated, or reversed over a 2-3 year horizon. New fields can be opened. OPEC can increase quotas.
Bitcoin’s supply ceiling is different in nature. It is written in code.
The numbers are simple and final :
21 million BTC maximum. Not a target. A hard cap encoded at the protocol level, immutable by design.
~20 million already mined. The remaining issuance is minimal and decreasing with each halving cycle.
3-4 million BTC estimated permanently lost — locked in wallets whose private keys no longer exist, sent to unspendable addresses, forgotten on hard drives from the early years of the network.
This leaves fewer than 17 million BTC realistically accessible in the entire world.
Of those, approximately 3 million BTC sit on exchanges — the real float available for trading at any given moment. The rest — more than 75% of circulating supply — is held by Long Term Holders (LTH) : entities and individuals who have not moved their coins in over 155 days and have demonstrated, cycle after cycle, that they do not sell.
In both cases — oil and Bitcoin — supply is fixed or near-fixed in the short term. The difference is that Bitcoin has a hard ceiling of 21 million units. Oil supply can eventually respond to price signals, given enough time and capital. Bitcoin’s ceiling is permanent, non-negotiable, and visible to everyone in the market simultaneously.
1.2 — But Will Bitcoin Even Survive ?
It is a fair question. And it deserves a direct answer before we go any further into mechanics.
Bitcoin has existed since 2009. In that time, it has survived an 80% crash — multiple times. It survived the collapse of Mt. Gox, the largest exchange of its era. It survived the FTX implosion, which wiped out tens of billions in a matter of days and triggered the kind of contagion that would have destroyed any asset without genuine underlying demand. It survived coordinated regulatory attacks from some of the world’s largest economies. It survived being declared dead by mainstream financial media more times than anyone has bothered to count.
It is still here.
But survival alone is not the argument. The argument is that Bitcoin has crossed a threshold beyond which the question of disappearance is no longer the relevant one.
In January 2024, the SEC approved the first US spot Bitcoin ETFs. BlackRock — the largest asset manager in the world, with $10 trillion under management — launched IBIT. When BlackRock decides to build a product around an asset, it is not making a speculative bet. It is responding to client demand that has already been validated at scale. The United States government has established a strategic Bitcoin reserve. Sovereign wealth funds have begun allocating. Pension funds are following.
This is not enthusiasm. This is infrastructure.
The practical reality is simple : enough people want Bitcoin as an asset class that an entire institutional ecosystem has been built around it. That ecosystem — custodians, ETFs, derivatives markets, regulatory frameworks — does not get dismantled. It compounds.
And underneath the institutional narrative sits something more fundamental. We live in a world where central banks have demonstrated, beyond any reasonable doubt, that they will print money when the system requires it. The 2020-2022 episode was not an anomaly. It was a confirmation. Fiat currencies are, by design, inflationary. Bitcoin, by design, is not.
You do not need to believe in Bitcoin’s philosophy to understand its appeal. You only need to observe that in a world of expanding money supply and shrinking purchasing power, a finite asset with a hard ceiling of 21 million units solves a real problem for a growing number of people.
“I don’t need to believe in Bitcoin. I need to observe that enough people do — and that the number keeps growing.”
The question is no longer whether Bitcoin will be part of our financial world. It already is. The question is what happens to its price when institutional demand keeps growing against a supply that cannot.
That is the question the rest of this article answers.
1.3 Demand : A New Structural Buyer Has Entered the Room
For most of Bitcoin’s history, demand was driven by retail speculation — volatile, emotional, and cyclical. That structure has fundamentally changed.
Three new categories of structural buyers have entered the market since 2024, and none of them behave like retail traders.
The ETF issuers. US spot Bitcoin ETFs — led by BlackRock’s IBIT — have become the dominant price-setting force in the market. The scale is striking : at peak inflow periods, these ETFs have absorbed up to 9 times the daily mining output of new Bitcoin.
But the mechanism matters as much as the scale. ETF issuers do not negotiate prices. When a new dollar flows into IBIT, BlackRock must go into the open market and buy whatever Bitcoin is available — at whatever price sellers are willing to accept. They work through the order book from the bottom up, lifting offers until the required amount is filled. With only 3 million BTC on exchanges and 75% of supply structurally illiquid, that order book is thin. When a large ETF buy hits a thin book, it does not move the price gradually. It tears through available supply, pushing the price up in discrete steps until enough sellers are found.
This is not discretionary buying. It is a market obligation with no price sensitivity.
The sovereign buyer. The United States has established a strategic Bitcoin reserve. A sovereign buyer operates on a different logic entirely — it does not buy to generate returns, it buys to hold. Coins acquired at the state level do not return to the market. They permanently reduce the float.
The corporate accumulators. Strategy Inc. and its growing list of corporate imitators systematically remove Bitcoin from exchanges into cold storage. Each purchase is permanent by design.
The table below shows the monthly ETF flow trajectory from October 2025 through March 2026 :
October 2025 : -$3.50B | ATH at $126,000 — mass profit-taking
November 2025 : -$3.48B | Continued de-risking
December 2025 : -$1.09B | Slowdown in outflows
January 2026 : -$1.60B | Macro risk-off
February 2026 : -$3.56B | Peak institutional capitulation
March 2026 : +$2.80B | Major reversal — net accumulation
April 2026 : +$2.44B | Institutional re-entry & rally toward $80,000
Five months of sustained outflows. Then a clean reversal. The structural buyers did not disappear during the correction — they accumulated. The float tightened further. And when sentiment turned, there were fewer coins available to absorb the demand than before the correction began.
1.4 The Supply Shock Mechanism — Why Small Flows Move Big Prices
The intuitive assumption is that a $3 billion inflow into a market with $250 billion in tradeable float should move the price by roughly 1.2%. Simple division.
That assumption is wrong, and there is rigorous academic work explaining why.
In 2021, Xavier Gabaix (Harvard) and Ralph Koijen (University of Chicago) published “In Search of the Origins of Financial Fluctuations : The Inelastic Markets Hypothesis” — one of the most consequential papers in modern finance. Their central finding : financial markets are far less elastic than classical theory assumes. In equity markets, $1 of net inflow moves total market capitalisation by approximately $5. The multiplier exists because most investors — index funds, pension funds, ETFs — have rigid mandates. They must buy regardless of price, and there are too few discretionary sellers to absorb the flow without significant price movement.
On Bitcoin, the multiplier is almost certainly higher. The reasons are structural :
The float is extraordinarily thin — 3 million BTC tradeable out of 17 million accessible
Long term holders have demonstrated near-zero price sensitivity — they do not sell into strength
ETF buying is non-discretionary, as described above
No short-selling mechanism exists at the scale needed to absorb large inflows
The practical implication : a $3 billion monthly inflow does not move Bitcoin 1.2%. Observed market behaviour suggests the real move is closer to 4% to 10%, and potentially more during periods of peak illiquidity.
This is not speculation. This is mechanics.
1.5 The 200-Week Moving Average — Sentiment Made Visible
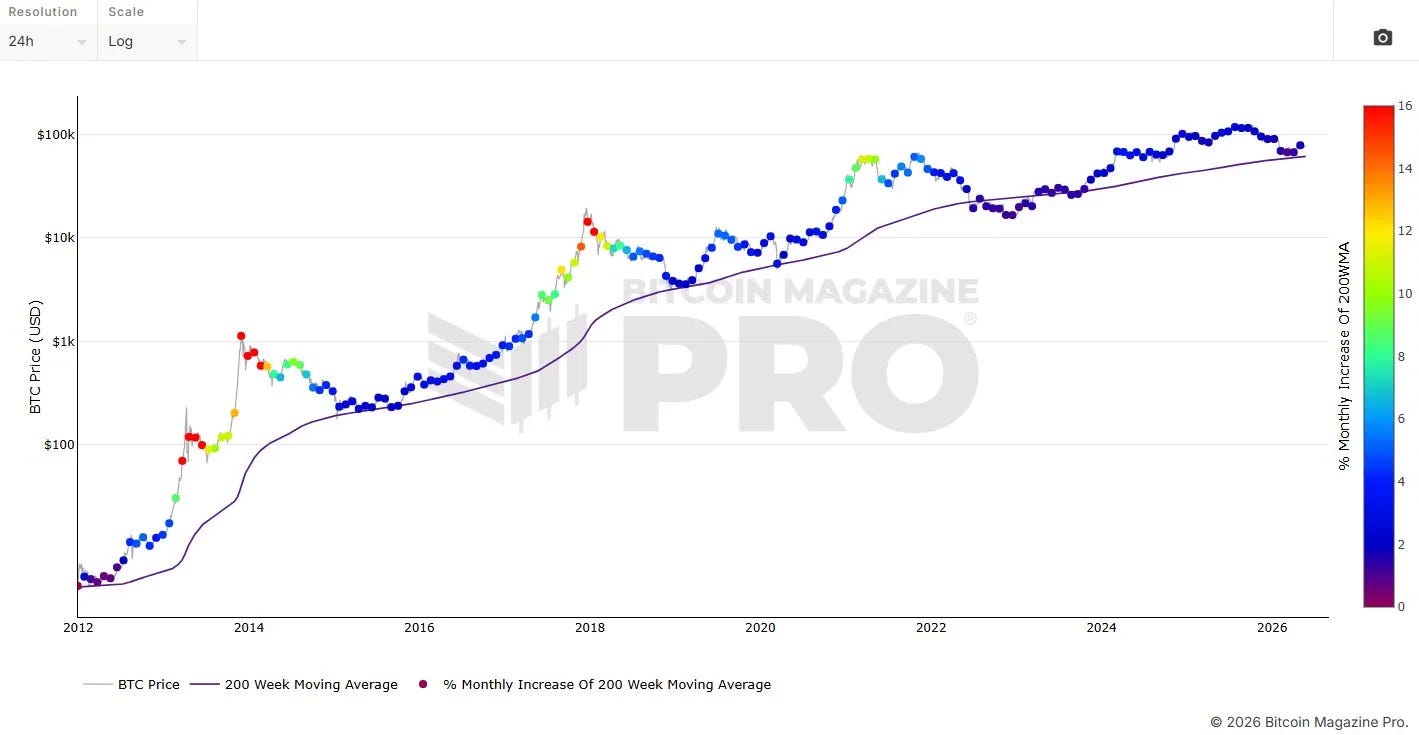
Blue dots : accumulation zones. Red/orange dots : cycle peaks. Purple line : 200W MA. Source : Bitcoin Magazine Pro.
Howard Marks describes market sentiment as a pendulum. It swings between fear and enthusiasm, rarely resting at the midpoint, always overshooting in both directions. The investor’s job is not to predict when it swings — it is to recognise where it currently is.
This chart is that pendulum, made visible.
Blue dots mark the fear phase : Bitcoin trading near its 200-week moving average, sentiment at its worst, long-term holders absorbing supply that short-term sellers are desperate to offload. Red and orange dots mark the enthusiasm phase : Bitcoin trading far above the 200W MA, narratives euphoric, cycle peaks forming.
The pattern has repeated without exception since 2012. Fear compresses the price toward the average. Enthusiasm explodes it away. The moves from blue to red are not incremental — they are multiples. 5x, 8x, 10x from trough to peak.
Today, Bitcoin is in blue territory. The pendulum is now at the fear end of its arc.
It always swings back.
Part 2 — Strategy Inc. : The Leveraged Proxy
2.1 What Strategy Inc. Actually Is
Strategy Inc. (NASDAQ : MSTR) is no longer meaningfully a software company. It is a Bitcoin accumulation vehicle, using convertible debt and equity issuance to acquire and hold Bitcoin permanently.
The key structural facts :
843,738 BTC on the balance sheet — the largest corporate Bitcoin holding in the world
~$8.2 billion in convertible debt — fixed obligations, not linked to Bitcoin’s price
Debt is unsecured — there is no covenant, no collateral, no mechanism that forces a Bitcoin sale at any specific price level
The legacy software business generates ~$460 million annually — negligible relative to the Bitcoin treasury, but sufficient to cover a portion of interest obligations
The company holds $2.25 billion in cash reserves, covering over 2.5 years of debt and dividend obligations without selling a single Bitcoin.
Understanding what Strategy Inc. is not is as important as understanding what it is. It is not an ETF. It is not a fund. It is a company that has made a permanent, structural bet on Bitcoin appreciation — and engineered its entire capital structure around that bet. The software business is a legacy artifact. The Bitcoin treasury is the company.
2.2 The Natural Leverage
The leverage in Strategy Inc. is structural, not speculative. It arises from a simple balance sheet dynamic : the debt is fixed, the assets (Bitcoin) are variable.
When Bitcoin rises, the value of the asset side of the balance sheet increases. The liability side does not move. The equity — the value accruing to shareholders — grows disproportionately faster than the underlying asset.
Historically, this has produced a beta of 1.5x to 3x relative to Bitcoin during bull phases. In concrete terms :
Bitcoin +10% → MSTR +15% to +40%
Bitcoin +50% → MSTR +150% to +300%
Options gamma squeeze : if Bitcoin crosses certain thresholds, forced short covering on MSTR options can produce moves of +70% for a +14% Bitcoin move
This is the same mechanism that made OKEA interesting as a proxy on oil. The underlying asset moves. The proxy amplifies. The fixed cost structure — whether it is drilling costs for an oil producer or convertible debt for a Bitcoin accumulator — creates the leverage naturally, without requiring any speculative instrument.
The leverage works in both directions. A 10% Bitcoin decline has historically produced a 20-25% MSTR decline. This is the price of the amplification, and it is precisely why entry point and exit discipline matter more for MSTR than for direct Bitcoin exposure.
2.3 The mNAV Premium — The Real Driver
The multiple-to-net-asset-value (mNAV) is the single most important metric for understanding where MSTR is in its cycle.
mNAV measures how much the market is paying for MSTR shares relative to the underlying Bitcoin value per share. At mNAV = 1.0x, you are paying exactly the Bitcoin value. At mNAV = 2.0x, you are paying double. The premium reflects three things : the built-in leverage that no ETF replicates, the rarity of a listed instrument offering 1.5x to 3x Bitcoin exposure without margin or expiry — accessible from any standard brokerage account, IRA, or tax-advantaged wrapper that cannot hold Bitcoin directly — and the sentiment of the market at any given moment.
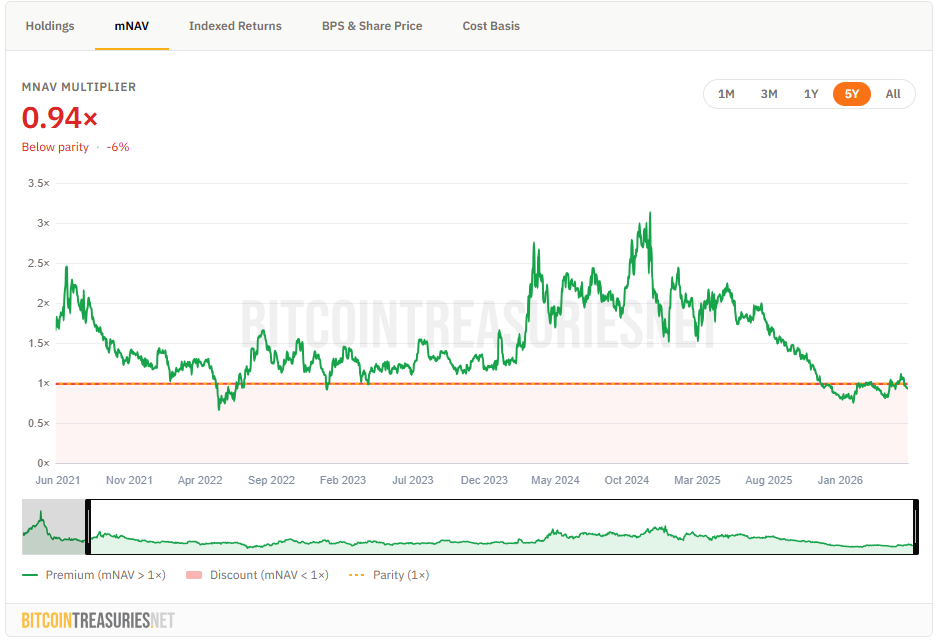
“MSTR mNAV Multiplier (2021-2026) : From 3x Euphoria to 0.94x Discount”
Howard Marks’ pendulum applies here too. The mNAV has its own fear and enthusiasm cycle, layered on top of Bitcoin’s :
Fear : mNAV compresses toward 1.0x — the market prices Strategy as if the flywheel is broken, the leverage is a liability, and Bitcoin will never recover
Accumulation : sophisticated investors buy at or near NAV — leveraged Bitcoin exposure at no premium
Bitcoin reversal : structural buyers absorb available supply, price inflects
Enthusiasm : mNAV expands as investors pay an increasing premium for leveraged exposure and optionality
Peak : mNAV reaches 3x-4x, the flywheel runs at full speed, the cycle peaks
In November 2024, mNAV reached 3.4x — investors were paying $3.40 for every $1 of Bitcoin held by the company. Enthusiasm at its peak.
Today, mNAV sits between 0.94x and 1.19x depending on methodology — the lowest range since the strategy was launched. Two ways to read the same signal : Saylor Tracker’s 0.94x measures equity market cap only against Bitcoin held, meaning you are currently buying MSTR’s Bitcoin at a 6% discount to spot price. Strategy’s own 1.19x includes the full capital structure — convertible debt and preferred shares — and is the figure management uses to define its 1.22x operational pivot. Both are near historic lows.
Two pendulums are currently compressed simultaneously : Bitcoin’s sentiment, visible on the 200W MA heatmap, and Strategy’s mNAV premium. When both swing back — and historically they always have — the amplification is not additive. It is multiplicative.
The management has itself defined the key threshold : at 1.22x mNAV, the economics of the flywheel shift. Above this level, issuing equity to buy Bitcoin is accretive — each share sold at a premium to NAV buys more Bitcoin than it represents, increasing BTC per share for existing holders. Below it, selling Bitcoin to buy back shares becomes more accretive than issuing new equity.
Both sides of this pivot are constructive for the shareholder. The market is currently pricing Strategy as if the flywheel is permanently broken.
2.4 Decorrelation from AI — An Important Distinction
Strategy Inc. is a risk-on asset. It rises when risk appetite rises, and it falls when it falls — similar in surface behaviour to high-growth technology stocks.
But the thesis is structurally decorrelated from the AI cycle.
AI valuations depend on capex cycles, model release cadence, enterprise adoption curves, and quarterly earnings revisions. A disappointment from a hyperscaler, a regulatory move on data centres, or a shift in the competitive landscape can reprice the entire sector overnight. The driver is execution — and execution can disappoint.
Strategy’s value depends on one variable : the price of Bitcoin. And Bitcoin’s price depends on supply constraints that are fixed by design, demand flows that are institutional and structural, and a monetary narrative that has nothing to do with GPU clusters or foundation models.
In practice, MSTR may move in the same direction as AI stocks on a given day — risk-on is risk-on. A broad market sell-off hits everything simultaneously, and a risk-on rally lifts everything together. But the drivers of performance are independent. Bitcoin does not care about Nvidia’s earnings. It does not care about OpenAI’s latest model. It does not care about hyperscaler capex guidance.
It cares about one thing : how many coins are available for sale versus how many buyers need to own them.
For an investor with significant technology exposure — and most sophisticated portfolios in 2026 have significant technology exposure — Strategy Inc. represents a genuine thematic diversification. Not a correlated bet dressed up differently. A structurally different engine, in a different asset class, responding to different signals.
The surface correlation is noise. The underlying drivers are independent.
Part 3 — The Risks
3.1 Dilution — The Real Risk
The risk that deserves the most attention is not bankruptcy. It is dilution.
Strategy funds its Bitcoin purchases through two mechanisms : convertible debt and equity issuance via an at-the-money (ATM) programme. When mNAV is high, each share issued at a premium to Bitcoin NAV is accretive — the proceeds buy more Bitcoin than the shares represent, increasing BTC per share for existing holders.
When mNAV is compressed — as it is today — the accretion is minimal. At 0.94x-1.19x mNAV, issuing shares buys only marginally more Bitcoin than the shares represent. If management continues issuing aggressively at these levels, existing shareholders are diluted without meaningful compensation in BTC per share terms.
This is the tension to monitor : the pace of ATM issuance relative to mNAV. The 1.22x management pivot is the reference point.
Dilution is why I don’t want to buy and hold Strategy out of this thesis. This is a trade with a defined entry, a defined target, and a defined exit. The thesis is not “own Strategy forever.” The thesis is “own Strategy while the pendulum swings from fear to enthusiasm — and exit before dilution quietly erodes what the trade has built.”
3.2 ETF Competition — The Structural Pressure
BlackRock’s IBIT and its peers offer direct Bitcoin exposure — simpler, cheaper, no dilution risk, no management execution risk. As institutional awareness of these products grows, the marginal dollar that might have gone into MSTR goes into an ETF instead.
This is not a temporary headwind. It is a structural shift in how institutions access Bitcoin — and it has a direct consequence on the mNAV premium that Strategy can sustainably command.
In 2024, before ETFs reached critical mass, investors accepted a 3x mNAV premium because MSTR was one of the only liquid, regulated instruments offering leveraged Bitcoin exposure at scale. That scarcity premium has been partially arbitraged away. It will not fully return.
My base case is that mNAV above 2.5x is unlikely to be sustained going forward. The ETF ecosystem has permanently raised the bar for what premium investors will pay for indirect Bitcoin exposure. Why pay 3x NAV for MSTR when you can buy Bitcoin directly through IBIT at 1x, with no dilution risk and no management execution risk?
The answer — leverage, tax wrapper access, brokerage account accessibility — justifies a premium. But a structurally lower one than the cycle peaks of 2024.
This is why my exit target of $500-600 is calibrated on a mNAV of 2x to 2.5x, not 3x. It is not pessimism. It is an honest adjustment for a market structure that has permanently changed.
The counter-argument — that MSTR retains irreplaceable value for investors in accounts that cannot hold Bitcoin directly — is real but insufficient to rebuild the 3x premium of 2024. The marginal institutional buyer now has a better alternative. The premium compresses accordingly.
3.3 Bankruptcy — The Wrong Conversation
This question dominates retail discussion of MSTR and it is largely a distraction.
The debt is unsecured. There is no liquidation trigger. The cash reserve covers 2.5 years of obligations. Strategy’s preferred shares (STRC) carry an 11.5% dividend — but management retains the ability to suspend that dividend to protect the principal, adding another buffer before any Bitcoin sale becomes necessary.
In a notable shift from its original stance, CEO Phong Le confirmed in May 2026 that selling Bitcoin to service debt or reduce obligations is now a viable operational strategy — no longer a last resort. The company is not a one-way bet with no exit valves. It has a layered defence.
And for the balance sheet to go underwater, Bitcoin would need to fall below $10,000-13,000 — an 85%+ decline from current levels.
That scenario deserves an honest treatment. But let’s keep a sense of proportion.
For Bitcoin to fall to $10,000 in 2026, the following would need to unwind simultaneously : the US strategic Bitcoin reserve, BlackRock’s IBIT and the entire ETF infrastructure, every corporate treasury that has adopted a Bitcoin standard, and the institutional custody ecosystem that has been built over the past three years. This is not impossible. It is, however, extraordinarily unlikely — and it would signal a systemic financial crisis of a magnitude that would make MSTR the least of anyone’s concerns.
The theoretical scenario comes in two versions.
Version one : Bitcoin falls to $10,000 and does not recover. The thesis is wrong, Bitcoin as an asset class is over, and MSTR is worthless. Every risk asset is in freefall. This conversation is irrelevant.
Version two : Bitcoin falls to $10,000 and recovers. Bitcoin fell 80%+ in 2018, 70%+ in 2022. It recovered both times, reaching new all-time highs. In the current cycle, the deepest correction from the October 2025 all-time high of $126,000 was approximately 36% — nowhere near the historical drawdown levels that would threaten Strategy’s balance sheet. The $10,000 scenario would require a drawdown four times deeper than anything this cycle has produced. In this scenario, Strategy Inc. — sitting on hundreds of thousands of Bitcoin accumulated over years — becomes the most leveraged instrument on the recovery trade ever constructed. The company that survives the trough owns the mountain.
And one final point : the graph in section 1.5 shows that Bitcoin’s volatility has a structural tendency to compress over time. Each successive cycle produces shallower drawdowns and less extreme peaks — the mechanical signature of growing adoption. The $10,000 scenario belongs to an earlier era of Bitcoin, before sovereign reserves, before institutional ETFs, before the asset became a standard allocation. The infrastructure that now surrounds Bitcoin has permanently raised the structural floor.
“The bankruptcy scenario and the generational opportunity scenario are the same moment, viewed from two different time horizons.”
The risk to size your position around is not bankruptcy. It is the slower, quieter, far more probable risk of dilution eroding BTC per share while Bitcoin consolidates for two years. That is the bear case worth modelling — and the reason entry point and exit discipline matter more than catastrophe scenarios that would require the dismantling of an entire sovereign and institutional ecosystem to materialise.
Part 4 — The Discipline : Entry, Exit, Execution
4.1 Valuation Dashboard — BTC Price vs mNAV
The table maps implied MSTR share prices across Bitcoin price and mNAV scenarios, with CAGR calculated on the assumption that the target price is reached within 2 years from the current price of $159.89 (May 22, 2026). If the target is reached sooner, returns are higher. If it takes longer, they are lower.
These calculations assume a BTC yield of zero — meaning no change in BTC per share over the holding period. This is a conservative simplification : as long as Strategy’s BTC yield remains positive (currently 9.4% year-to-date), every new share issued is accretive to BTC per share, which increases the implied share price above the figures shown. Any positive BTC yield makes these numbers a floor, not a ceiling.
Methodology : BTC per share (basic) × BTC target price × mNAV target = MSTR implied share price. Current BTC per share : 0.002403 (source : Saylor Tracker / Bitcoin Treasuries, May 22, 2026). Current BTC price : $76,610. Current MSTR price : $159.89. Current mNAV : 0.86x.
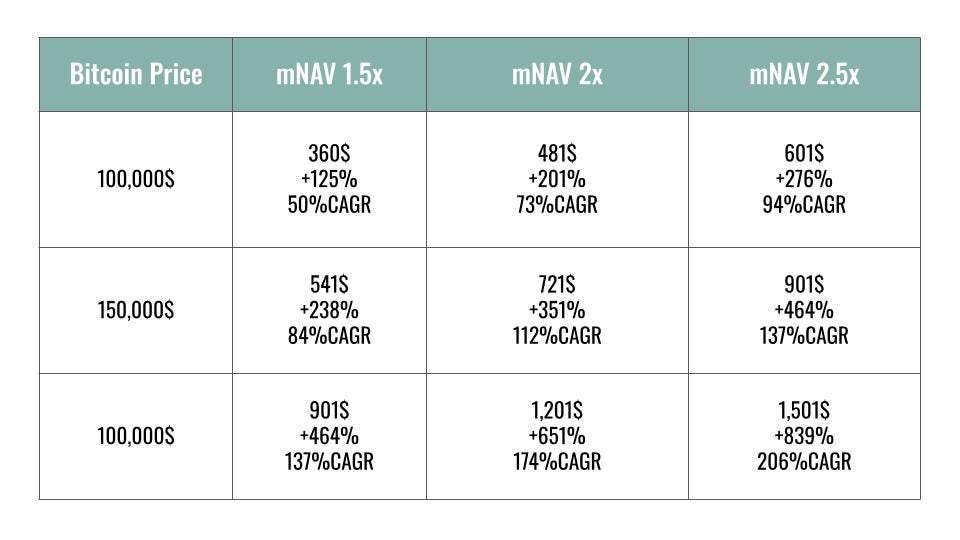
CAGR calculated from $159.89 (MSTR closing price, May 22, 2026). Formula : (exit price / $159.89)^(1/2) — 1. mNAV 3.0x excluded from base case — see section 3.2.
The conservative exit target of $500-600 maps to BTC at ~$100,000 with mNAV between 2.0x and 2.5x. That is not an optimistic scenario — it is BTC recovering to a level it has already reached, combined with a mNAV normalising from its current historic low. At $150,000 BTC with mNAV 2.0x, the implied price is already $721.
Two variables drive the outcome. Bitcoin’s price is the engine. The mNAV is the multiplier. Both are currently compressed. Both have expanded before. The table shows what happens when they expand simultaneously.
4.2 The OKEA Playbook — Same Framework, Different Asset
The OKEA trade was not a lucky call. It was the application of a repeatable framework, executed in four steps.
Step 1 — Fundamentals justify the entry.
OKEA was in a temporary production trough — new wells under development, high capex, dividend suspended for several quarters. The market priced it as a broken story. It was a sequencing problem, not a structural one. Two catalysts in view : production recovery as new wells came online, and the oil price itself. Either was sufficient. Both together created the asymmetry.
Step 2 — The underlying asset is inelastic. Oil supply cannot respond quickly to demand shocks. Any disruption — geopolitical, weather, infrastructure — hits price before supply can adjust.
Step 3 — An exogenous catalyst amplifies the mechanism. The Iran conflict was not predicted. But when it arrived, the framework identified exactly what would happen : an inelastic asset under supply shock moves disproportionately, and the leveraged proxy amplifies every point of that move.
Step 4 — The exit is defined before the catalyst arrives. I entered OKEA on the hypothesis that a conflict would drive the oil price higher. When that scenario materialised and reached a plateau — Brent near $120, geopolitical risk premium fully priced in — the thesis was complete. The position closed.
But the exit framework had a second layer. In the event of further escalation — a broader market crash driven by an intensification of the conflict — a contingency plan was already in place before entry. The scenario was mapped. The decision was not made under pressure.
This is the discipline that matters most : not the entry, not the target, but the fact that every foreseeable outcome had a pre-defined response before the first share was purchased.
The same discipline applies to Strategy Inc.
Strategy Inc. follows the same four steps :
Fundamentals : mNAV at historic lows, debt structure intact, cash covering 2.5 years of obligations, BTC per share growing at 18% year-over-year
Inelastic asset : Bitcoin supply mathematically capped, ETF demand non-discretionary, float shrinking structurally
Exogenous catalyst : geopolitical de-escalation, macro risk-on rotation, continued institutional adoption
Exit defined : initial target $500-600, with clear reversal signals monitored in real time
4.3 The Exit — Directional, Not Mechanical
The exit strategy is directional, not mechanical. The initial target is $500-600 per share — consistent with BTC at $100,000 and mNAV between 2.0x and 2.5x. Beyond that threshold, several approaches are possible depending on market conditions at the time :
A full exit if mNAV signals are clearly in euphoria territory (>2.5x) and ETF flows turn sustainably negative
A laddered reduction : for every 10% increase in the share price above the initial target, 10% of the remaining position is sold. At $550, sell 10%. At $605, sell 10% of what remains. At $665, another 10%. In practice, this caps the total exposure as the trade moves into euphoria territory — the position size shrinks as the risk increases.
A partial hold if the thesis remains intact and BTC shows no signs of structural reversal
The honest answer is that the exact exit will be determined by conditions that don’t yet exist. What is defined in advance is not the precise exit point, but the signals that will trigger it : mNAV expansion toward 2.0x-2.5x, ETF flows turning sustainably negative, and the Bitcoin 200W MA heatmap moving from blue to orange territory.
The pendulum tells you when to leave the room. You don’t need to decide exactly how fast to walk out the door before it starts swinging.
Conclusion — The Same Trade, A Scarcer Asset
The OKEA trade worked because three things were true simultaneously : the fundamentals were solid, the underlying asset was inelastic, and an external shock hit a thin market.
The Strategy Inc. trade is the same structure. The fundamentals are intact — the debt is manageable, the cash is there, the BTC per share growing at 18% year-over-year is the right metric to watch. The underlying asset is more inelastic than oil has ever been, constrained not by geology or politics but by protocol. And the external conditions — geopolitical de-escalation, institutional adoption, sovereign accumulation — are already visible in the flow data.
The difference is permanence. Oil can be replaced. OPEC can open the taps. A president can press a button.
Bitcoin cannot be recoded.
This is not a bet on crypto technology. It is not a bet on Michael Saylor’s vision or on the next cycle of retail euphoria. It is a bet on the mechanics of inelastic markets — a framework tested on oil, validated by a hundred and ten percent return in less than nine months, and now applied to the scarcest asset that has ever existed.
Important Disclosure & Disclaimer:
All content published by JB Peter on this platform is strictly for educational and informational purposes. It does not constitute investment, financial, legal, or tax advice, nor does it represent a personal recommendation or solicitation to buy or sell securities. This research is operated by ORIACON (SASU) and reflects independent corporate analysis. Every reader must conduct their own independent research (Due Diligence) or consult a licensed professional before making any financial decision, as financial markets involve a high risk of capital loss. At the time of writing, ORIACON or the author HOLD shares in the company analyzed in this article. Following this publication, ORIACON and the author reserve the right to buy, sell, or modify positions in any security mentioned at any time, without prior notice to readers or subscribers.