
I do not know about you, but for my part, when my portfolio goes up, I am delighted with my talents.
It also happens to go down. And I inevitably start asking myself, “but why?”
It is even worse when my portfolio falls more than the index.
And the waltz of questions begins.
“Have I selected the wrong companies?
Do I have a sizing problem?
Have I chosen the wrong sectors?”
Perhaps you recognize partly yourself in this, and you’re looking for answers too.
The aim of this article is to give you a method to identify the main drivers of your portfolio’s performance, examine companies’ fundamentals, and distinguish changes in business performance from changes in market valuations.
I’m not here to tell you whether your investment decisions were right or wrong.
We’ll focus on a portfolio of individual stocks and cash, without leverage.
And at the end of the article, you’ll find a ready-to-use prompt you can give to your favorite AI to analyze your own portfolio.
1. Choose a comparison basis
You must first establish a basis for comparison. This means choosing an analysis period and a relevant benchmark.
For a portfolio mainly invested in US equities, the S&P 500 is a natural comparison.
But be careful: comparing returns without comparing risks can lead to wrong conclusions.
It does not make much sense to compare Walmart and Nebius directly. One has a relatively predictable business, while the other has a radically different growth and risk profile.
At the portfolio level, it is the same thing.
If you are 100% invested in technology stocks, you might be tempted to take the Nasdaq-100, but it has many non-tech companies (36% outside tech, with names such as PepsiCo), you can choose an index such as the MSCI World IT.
If you hold European equities, take the STOXX 600, etc.
On the technical side, simply make sure to compare returns in the same currency, including dividends, and to use a return that properly accounts for deposits and withdrawals.
Be careful, in particular, with screenshots of brokerage accounts: the change in account value does not necessarily correspond to its performance. Interactive Brokers, for example, lets you distinguish time-weighted return (TWR) from money-weighted return (MWR).
2. Identify the companies that explain the gap
Generally, most gains and losses are explained by a minority of determining factors. This is an application of Pareto’s law.
If you have a stock that loses 50% but represents only 1% of the portfolio, it will have the same effect as a stock weighing 10% of your portfolio and losing 5%.
Even if returns are explained by a minority of stocks, it is in your interest to study all your companies, because each of them holds an explanation that can help you progress.
The only difference is that the lesson will have cost you less, in the case of a loss.
Also remember to distinguish absolute performance from performance relative to the benchmark.
A company that gains 10% may have hurt you if your benchmark rose 25% over the same period.
Conversely, a position that loses 10% may have limited underperformance if the index fell 20%.
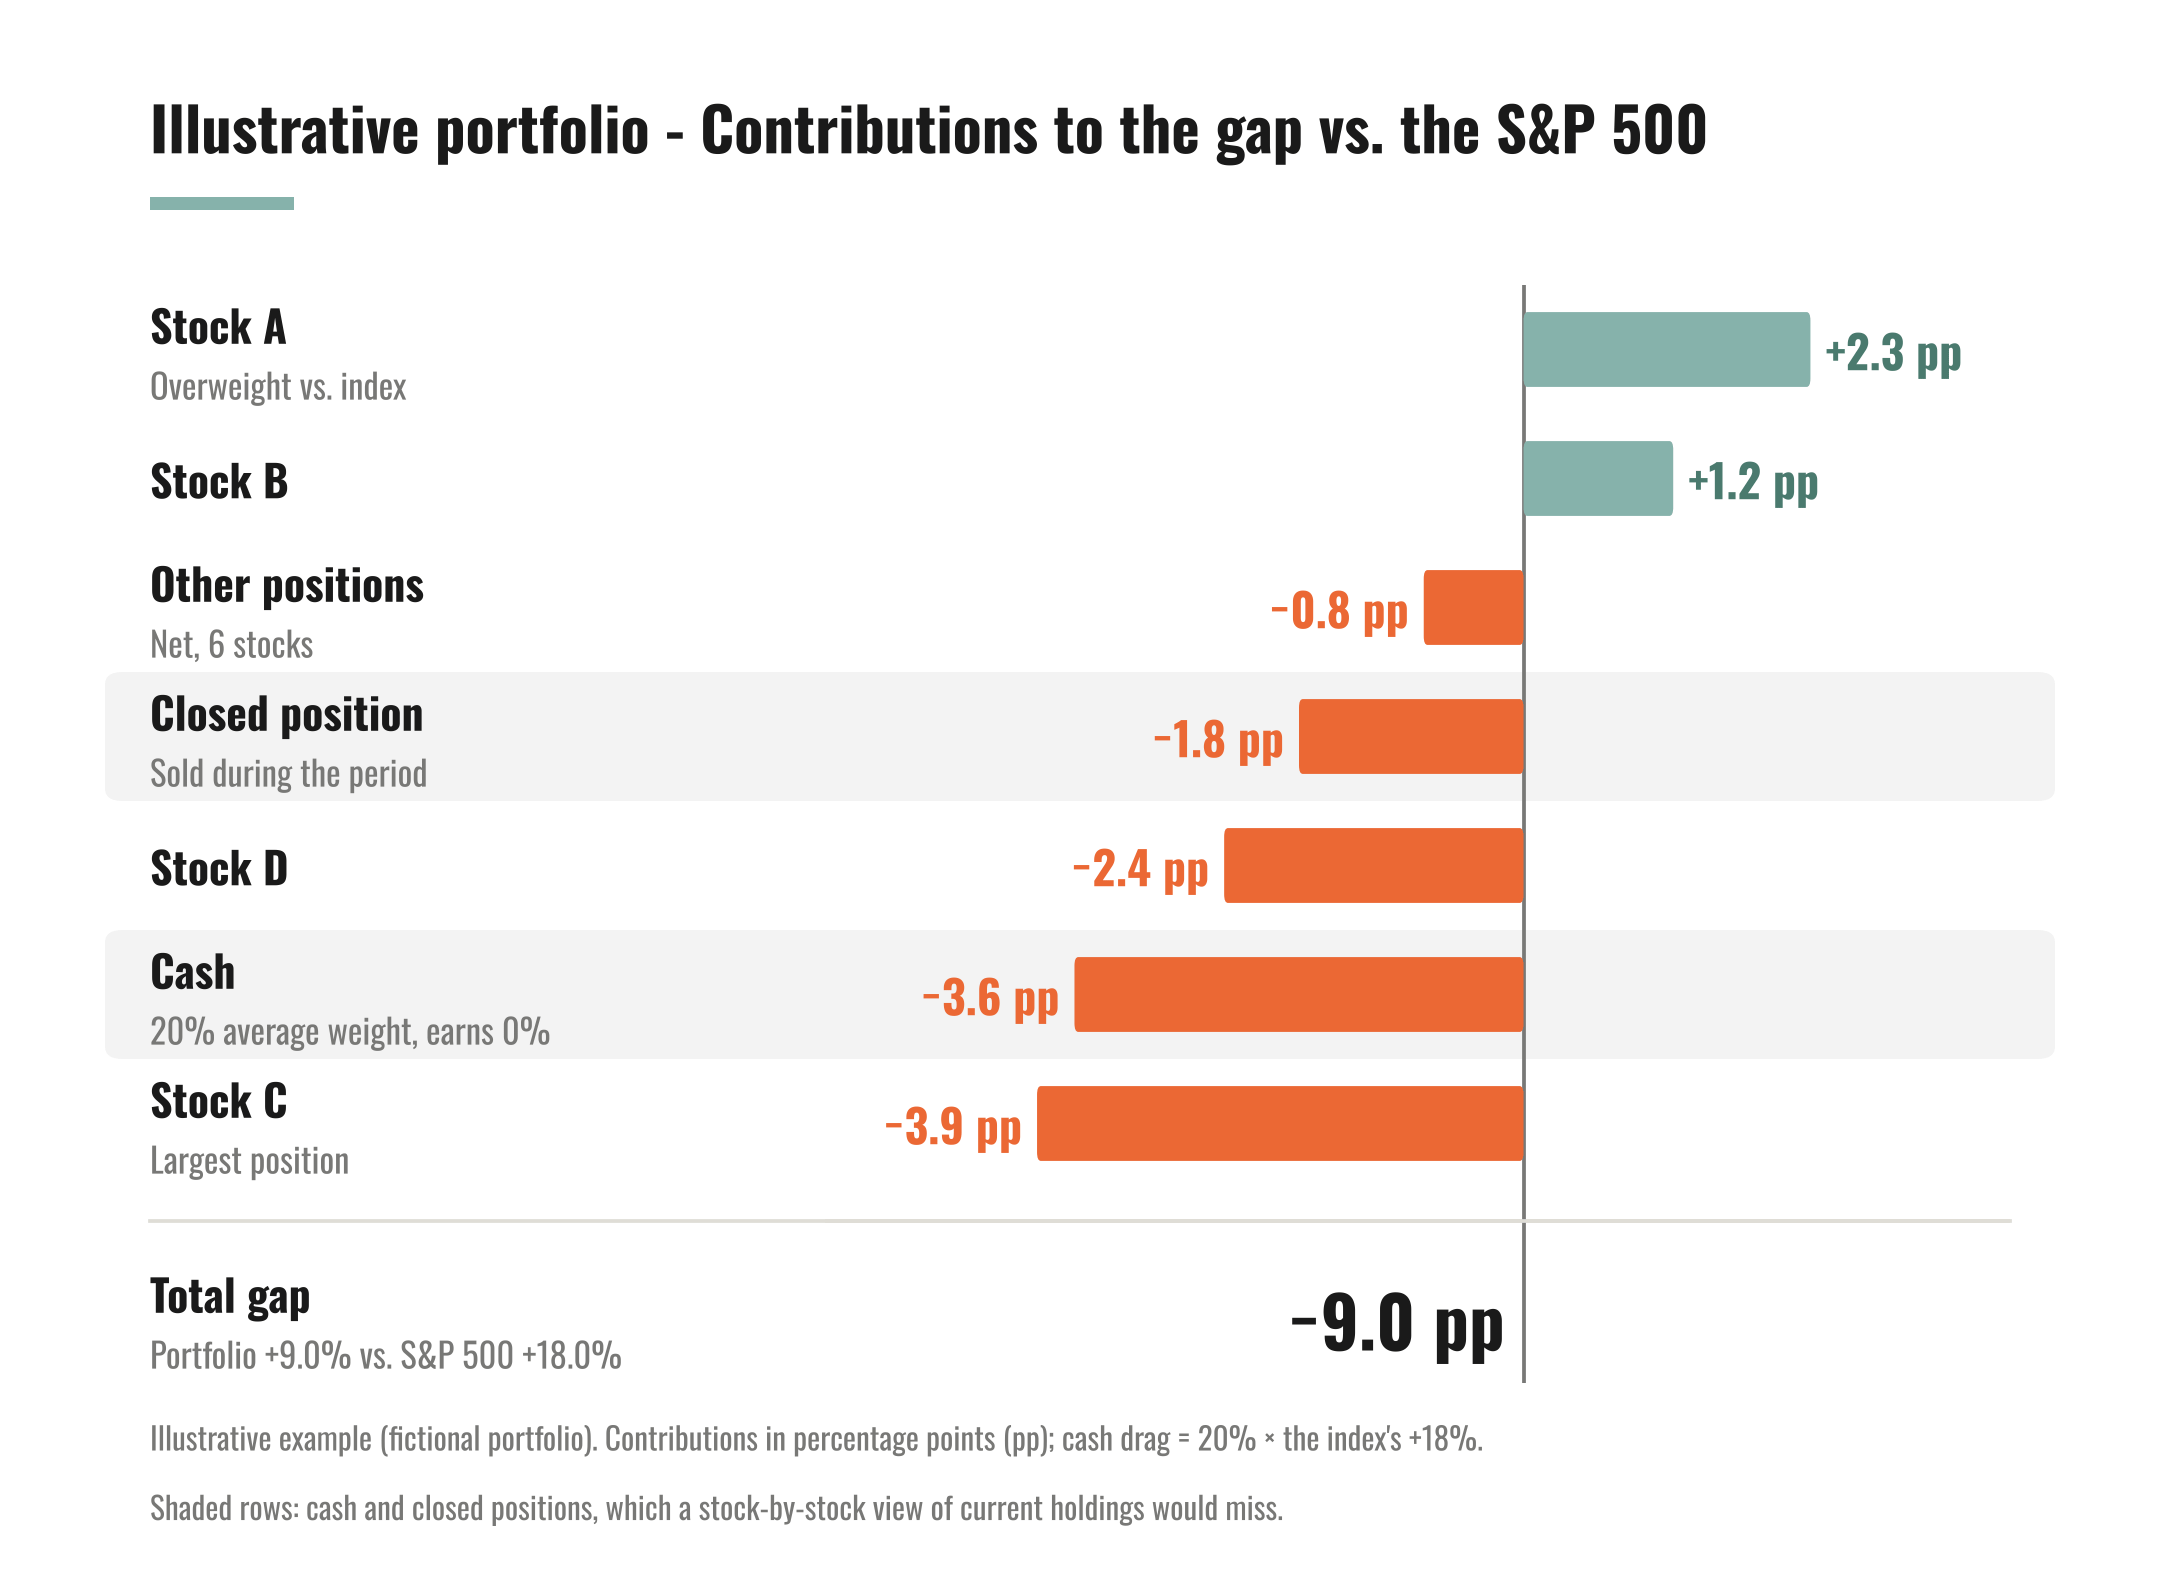
What interests us is each position’s contribution to the gap with the index.
The analysis must also include transactions made during the period, which can explain a large part of positive or negative gaps.
This includes rotations, which will have a positive or negative effect, and additions or withdrawals of capital (or leverage). If you have €50,000 and add €5,000, that is 10% more thanks to your savings, which is an excellent thing for your wealth, but requires an adjustment when analyzing your performance.
If you have a portfolio with 20% cash, and assuming for simplicity that it earns nothing, you miss 20% of the rise or 20% of the fall.
So you mechanically cannot match the S&P 500 with a portfolio made up of 80% S&P 500 and 20% cash during a rising market.
The diagnosis must make it possible to answer four questions:
Which companies explain most of the gap?
What was the effect of their weights?
What contribution came from purchases, sales and additions to positions?
What was the effect of cash?
3. The two dimensions of the share price
The fact that a company has lost 30% on the stock market does not necessarily mean that it is doing 30% worse.
The key is to split the investment into two parts and study each one separately. And that is fortunate, because the P/E ratio lets us do this easily:
Share price = (Normalized) earnings per share × P/E
The earnings-per-share part corresponds to fundamentals, and the multiple to market sentiment, which itself reflects expectations.
It is often necessary to adjust earnings for exceptional or financial items to establish a sound basis for comparison. Other, more complex indicators can be used, such as FCF, EBIT, OCF, etc.
This formula has the advantage of simplicity.
Example: a company that improves, but whose share price falls
Imagine a company whose normalized earnings per share go from €5 to €6.
Its earnings therefore increase by 20%.
But at the same time, its P/E goes from 20 to 15.
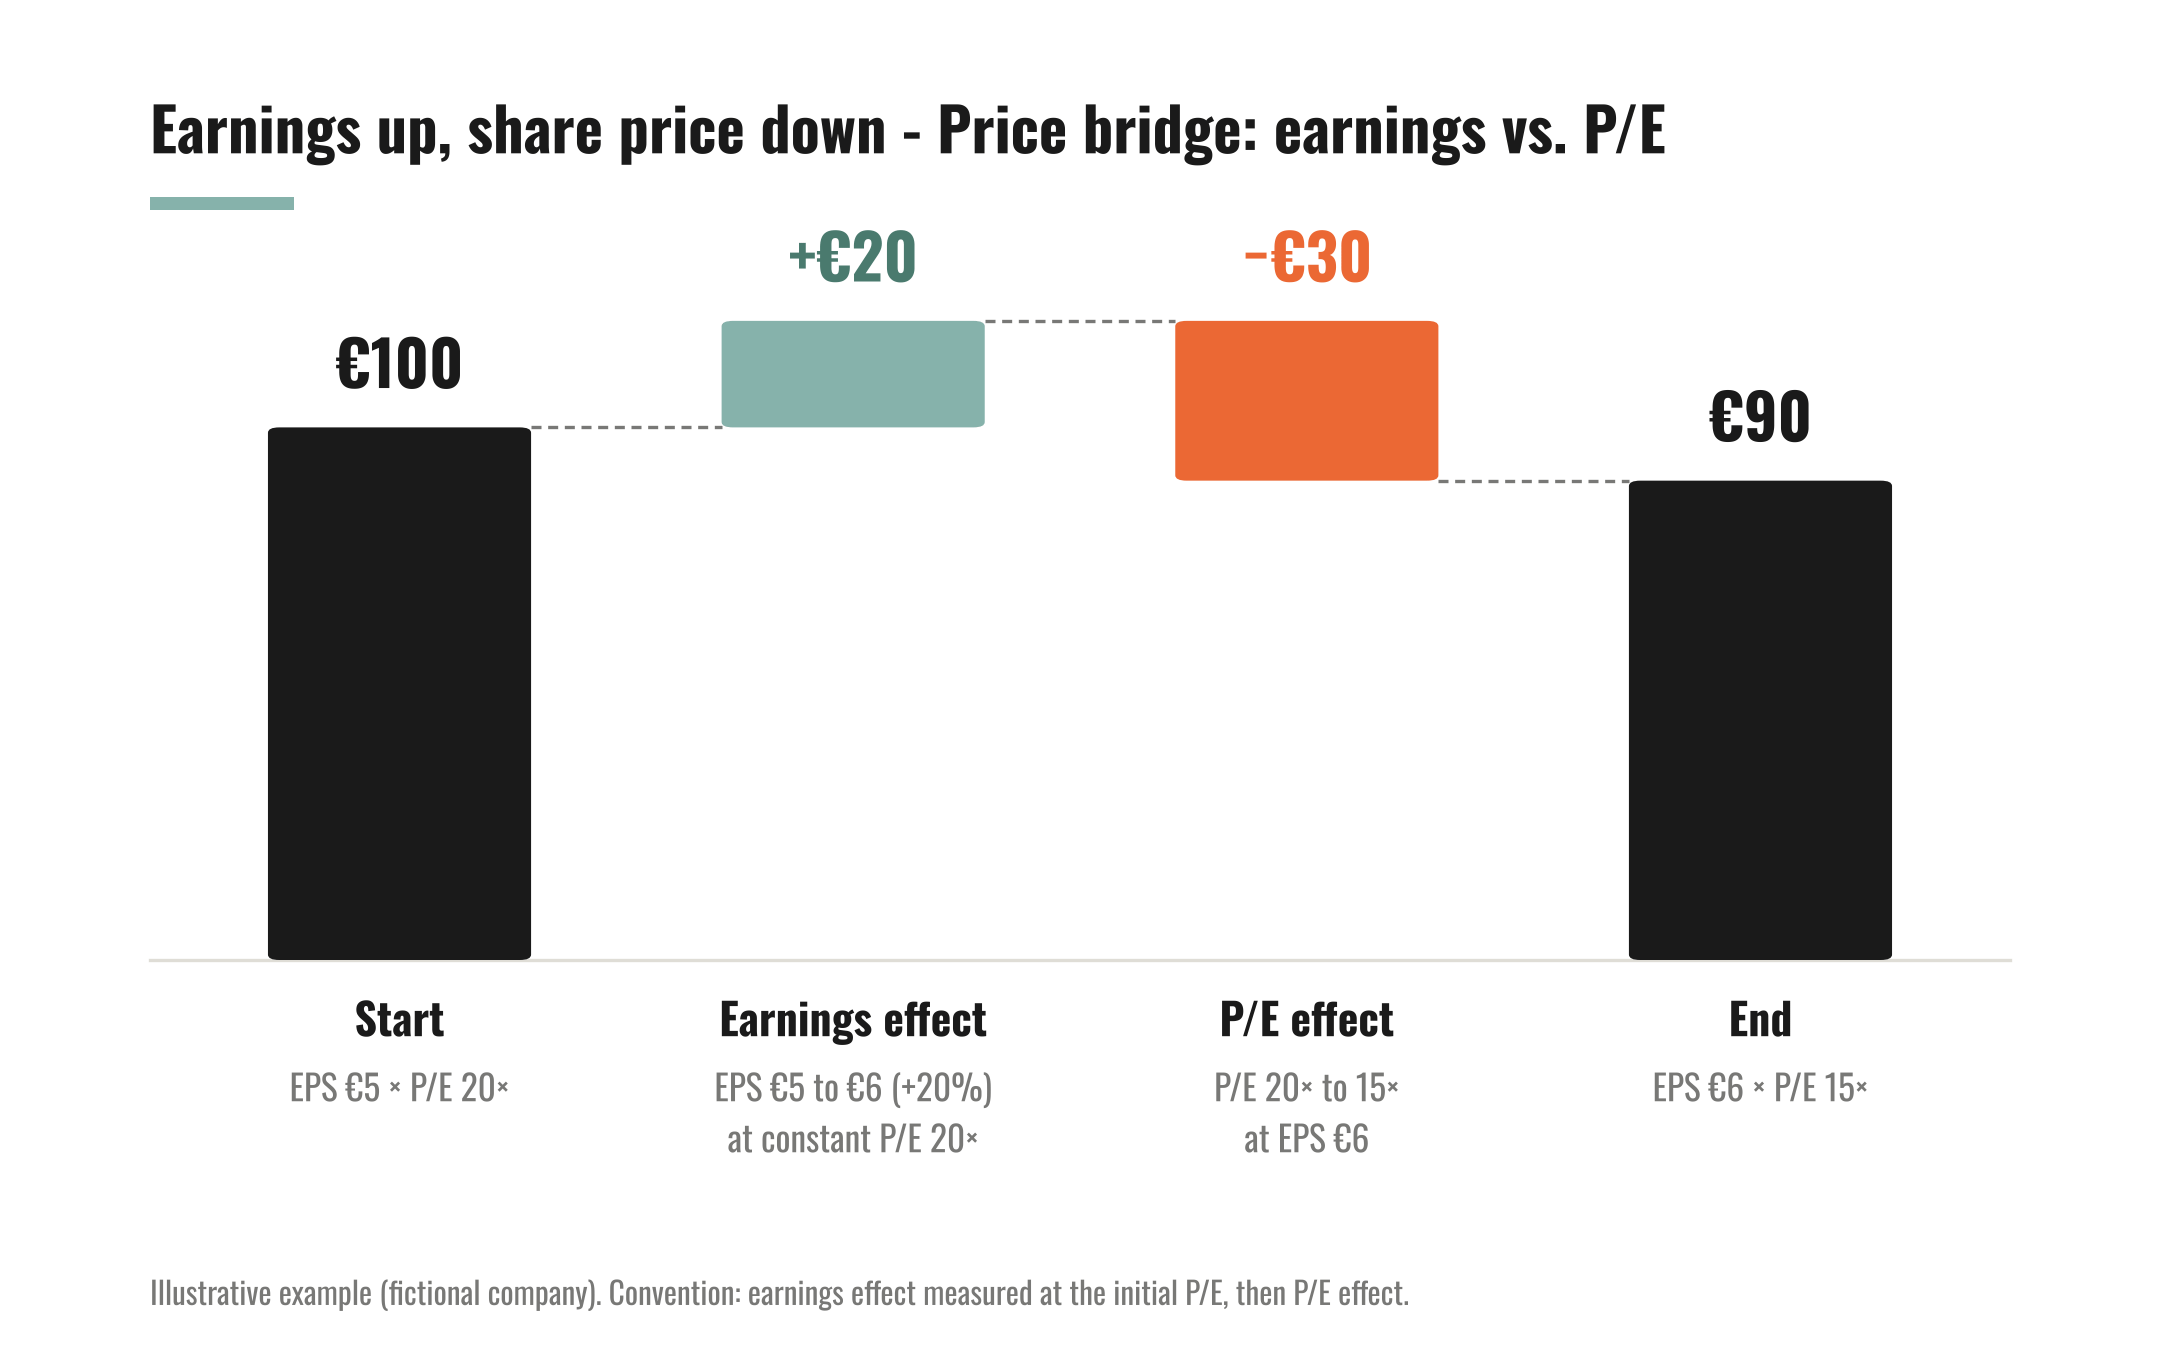
In this example, the decline comes from a contraction of the multiple, despite earning 20% more per share.
At a constant multiple, earnings growth would have taken its share price to €120.
And if the company is not profitable?
When normalized earnings are not positive and usable, we can use sales per share and the Price-to-Sales multiple:
Share price = Sales per share × P/S
The logic remains the same: distinguish the evolution of the business from that of the valuation multiple.
Generally, this type of company is even more difficult to value, which explains large and often unreasonable share-price movements.
4. Start with fundamentals, then study the multiple
The decomposition between earnings and multiple allows us to measure what has changed. It does not prove that the market’s reaction is justified or excessive.
To answer this question definitively, we must start with fundamentals, which will inform us on the following point: “Is the company in a better position than at the beginning of the period?”
The simplest thing is to have an investment thesis, if possible updated at the beginning of the period, then to consider the elements that have changed since:
What are the results?
Margins and profitability.
Debt and financial position.
The main growth prospects.
What risks and opportunities could arise?
How is the competition doing?
A good investment thesis will indicate a bull thesis and a bear thesis, sometimes materialized in the form of key risks to the business, whose realization may draw closer or move further away.
And if you do not have a written thesis, you can still carry out the financial diagnosis. You simply will not be able to verify as reliably what you had initially expected.
The aim is not to redo a complete analysis of the company. We are trying to determine whether its economic position has improved, deteriorated or remained broadly stable.
Think of the market as an evaluating machine. Every new event and every update of a probability will influence the multiple.
The whole aim will be to ask: “Is the development of the business good? Is the development of the price consistent with this development in fundamentals?”
The evolution of the multiple will follow four levels: the company, the sector, market factors and the market.
Company: for example, the CEO dies or becomes involved in legal cases (or even extramarital affairs that constitute a threat to US national security, to tie in with current events).
Sector: if your company has lost 25% while its sector has fallen 30%, the reading is different from that of a company that loses 25% while its competitors advance.
Market factors: some companies move together independently of their sector. Investors may, for example, abandon growth stocks in favor of value stocks, or favor large-cap companies. Momentum also plays a role and is a well documented pattern amongst investors.
Market: the whole equity market tends to move together according to interest rates or financing conditions.
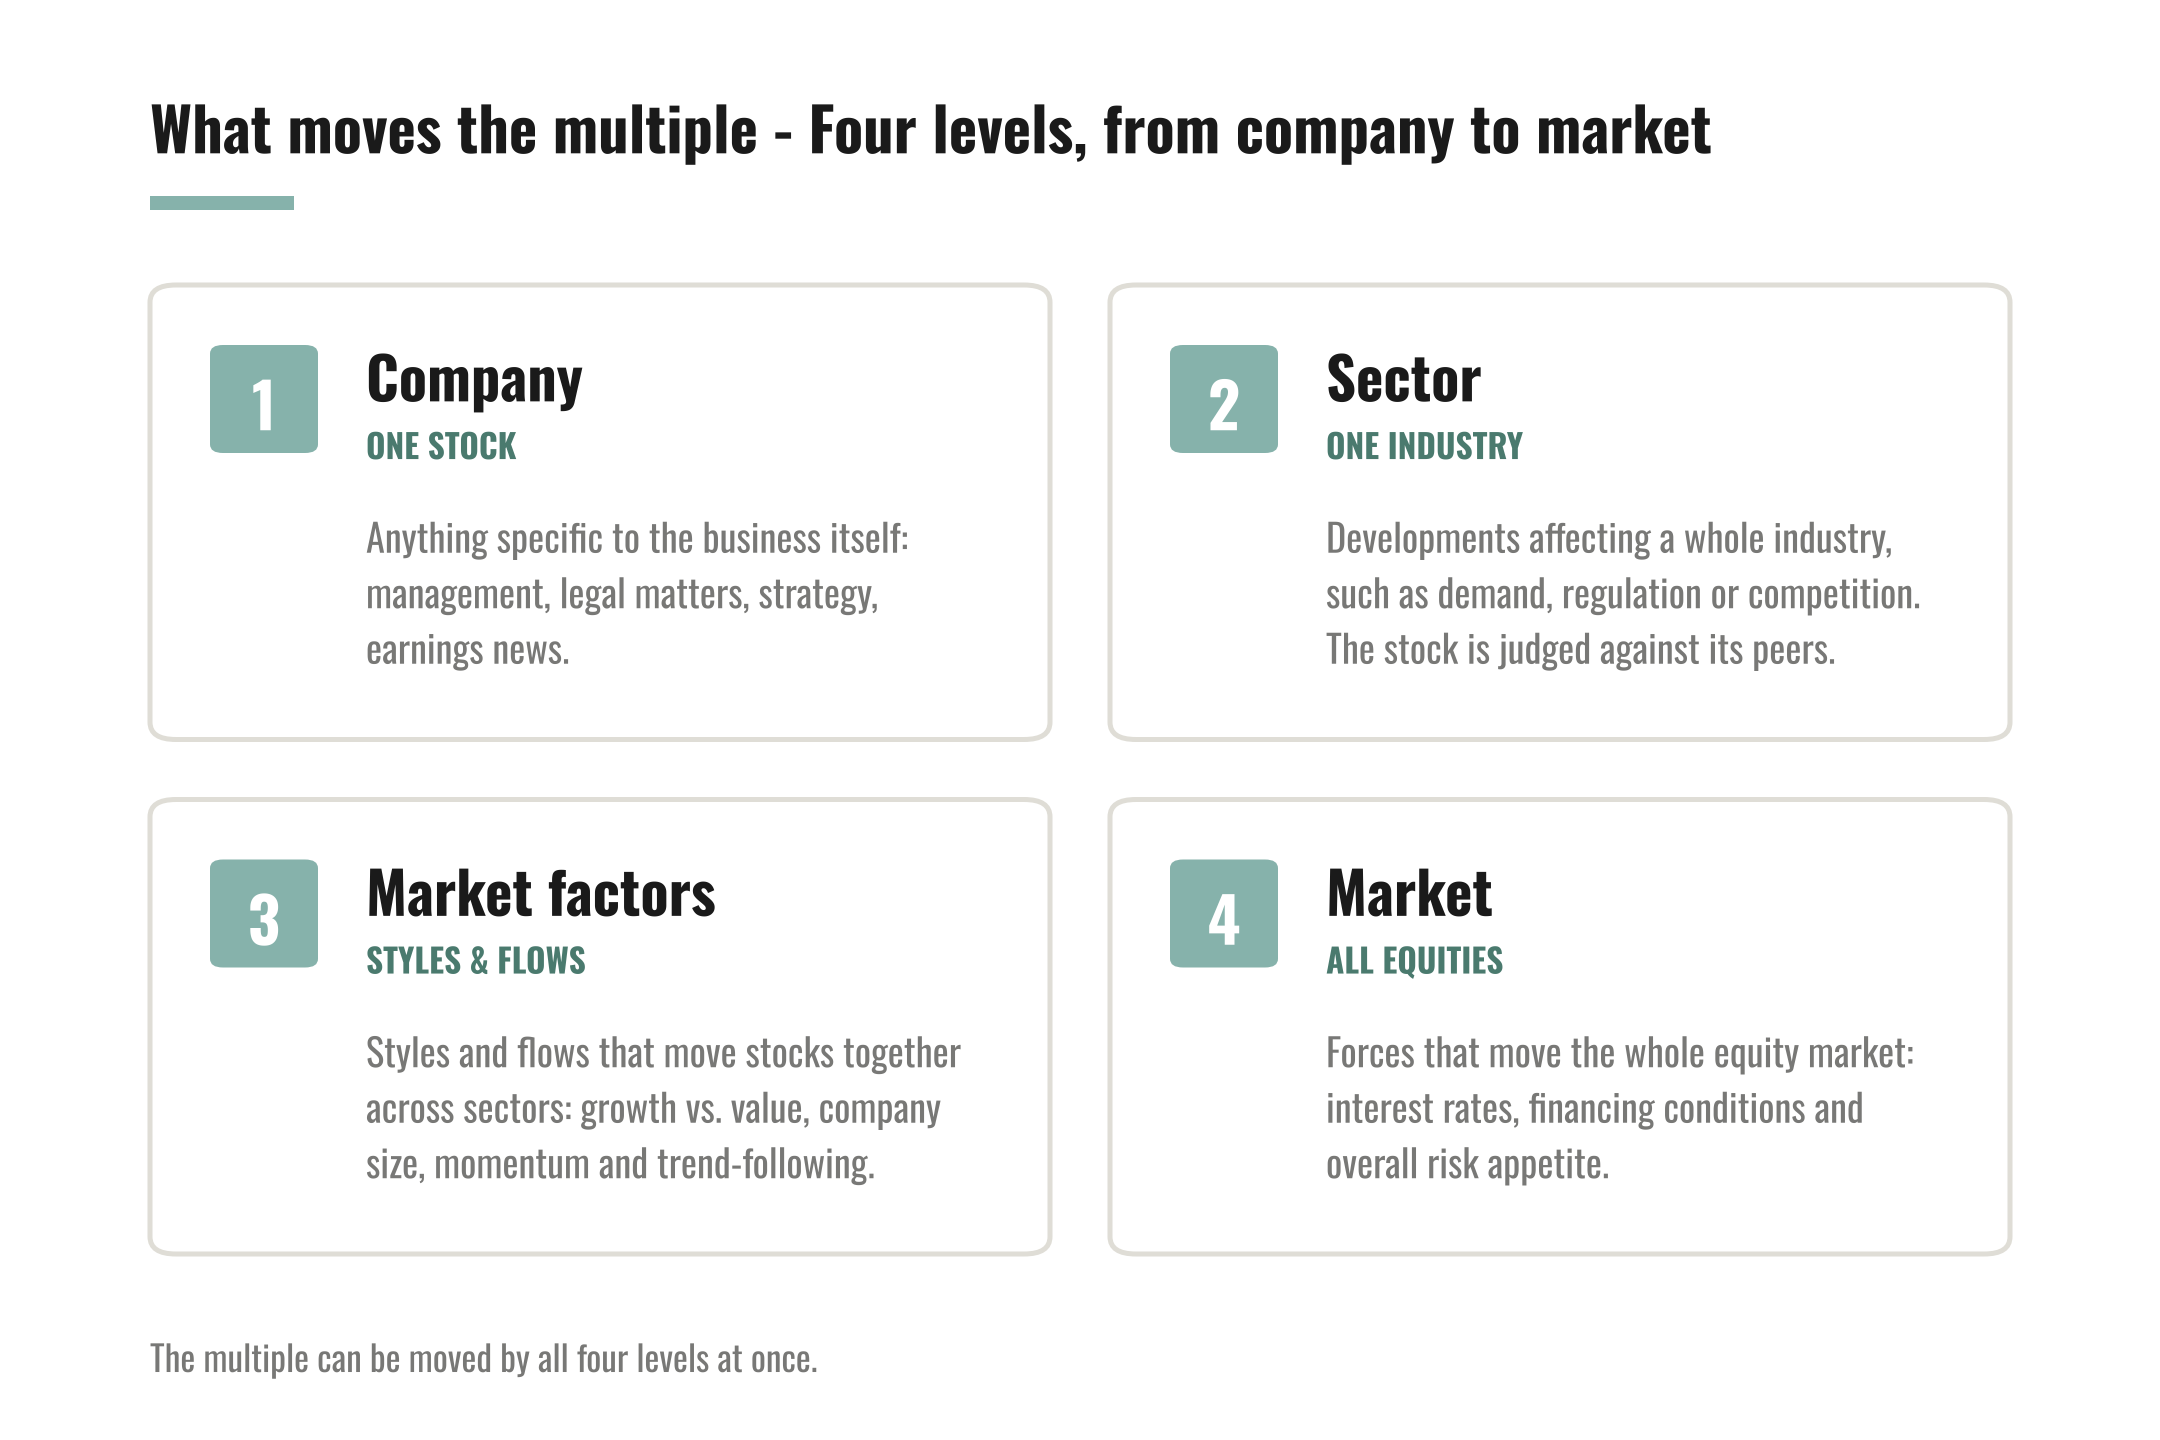
The evolution of the multiple can encompass all four at once, for example:
Less favorable growth expectations.
Deteriorating profitability prospects.
An increase in risks.
A rise in interest rates.
An initially too-demanding valuation.
A price that has been falling constantly for six months.
As mentioned in my stock analysis article, we are dealing here with pricing, which consists of assigning a price relative to alternatives, such as competitors’ prices or another yardstick. Valuation seeks the intrinsic value of the company, without taking competitors’ valuations into account.
5. What can we really conclude? Luck, skill and learning
Time will make it clear
In practical terms, you will assess fundamentals, then see whether the multiple is consistent.
It is the investor’s whole skill to judge between fundamentals and price, and whether there is an asymmetry between the price (which contains an implicit risk) and the opportunities.
The central hypothesis of investing consists in finding a valuation error and then waiting for the market to correct it and thus join you later in your analysis.
The key to investing is time, because it is time that will prove you right or wrong, and separate luck from talent.
We take a position on a future that may or may not materialize.
I cannot give you a framework for analyzing your portfolio in just a few words.
That is why the objective of this article is to get a first grasp of fundamentals and the evolution of the multiple, to gain clarity and so that you can form an opinion.
In general, here are also a few points to take into account in your study.
Beware of hindsight bias
I come from the world of project management, where studying cognitive biases is an essential part because they influence the decision-making process. There is one that is particularly interesting for lessons-learned reviews: hindsight bias.
It consists of regarding an event as predictable once it has happened. We see the day when the signal appeared and has been visible ever since.
How can you protect yourself against a cognitive bias? Knowing it exists is a first protection, which you can improve by keeping a record of the hypotheses and risks identified before the investment.
The cost of learning
Your experience must also be taken into account.
In my Investing 101 series, I distinguished three stages in an investor’s journey: the learning phase, the transition toward a target portfolio, then the maturity phase.
If you start your journey as an investor, beating the S&P 500 is not necessarily your first objective, and making mistakes is unavoidable. These are your tuition fees on the market.
But I would even add that this mindset and this practice of investing will be useful in your professional projects by giving you an owner mindset, and will allow you to become better in your projects, whether in entrepreneurship, real-estate purchases or other endeavors.
6. Analyze your portfolio with AI
The method we have just seen can be applied to your own portfolio or individual stocks.
Here is the prompt ready to copy, available for free subscribers. I suggest copying and pasting it and adapting it to make a document ready to use with your AI. Or download this article, so you can ask your AI to execute the prompt and make you the same kind of picture.