
Many readers showed great interest in my article on 48 Western Quality Small-Caps With Long-Term Potential.
So I decided to go a step further, expanding the selection to include more companies, more market capitalizations, and more investment themes.
That’s why I created a watchlist of 209 companies, available for free subscribers.
Historically, stock-market wealth creation has been concentrated in a small minority of companies. Research by Hendrik Bessembinder found that the best-performing 4% of US-listed companies accounted for all net stock-market wealth creation between 1926 and 2016.
Many successful businesses share certain characteristics: strong market positions, leadership in niche markets, oligopolistic industry structures, or sustainable competitive advantages.
My goal is to identify companies with these characteristics and monitor them for potential investment opportunities.
You can now filter the watchlist by company size (large, mid, or small cap) and by investment theme, making it easier to discover businesses that match your investment interests.
1. Eight investment themes to explore
Not all successful businesses follow the same model.
Some dominate their industries, others operate in highly specialized markets, while others grow by acquiring smaller competitors.
I’ve organized the watchlist around eight investment themes. A company can belong to several themes.
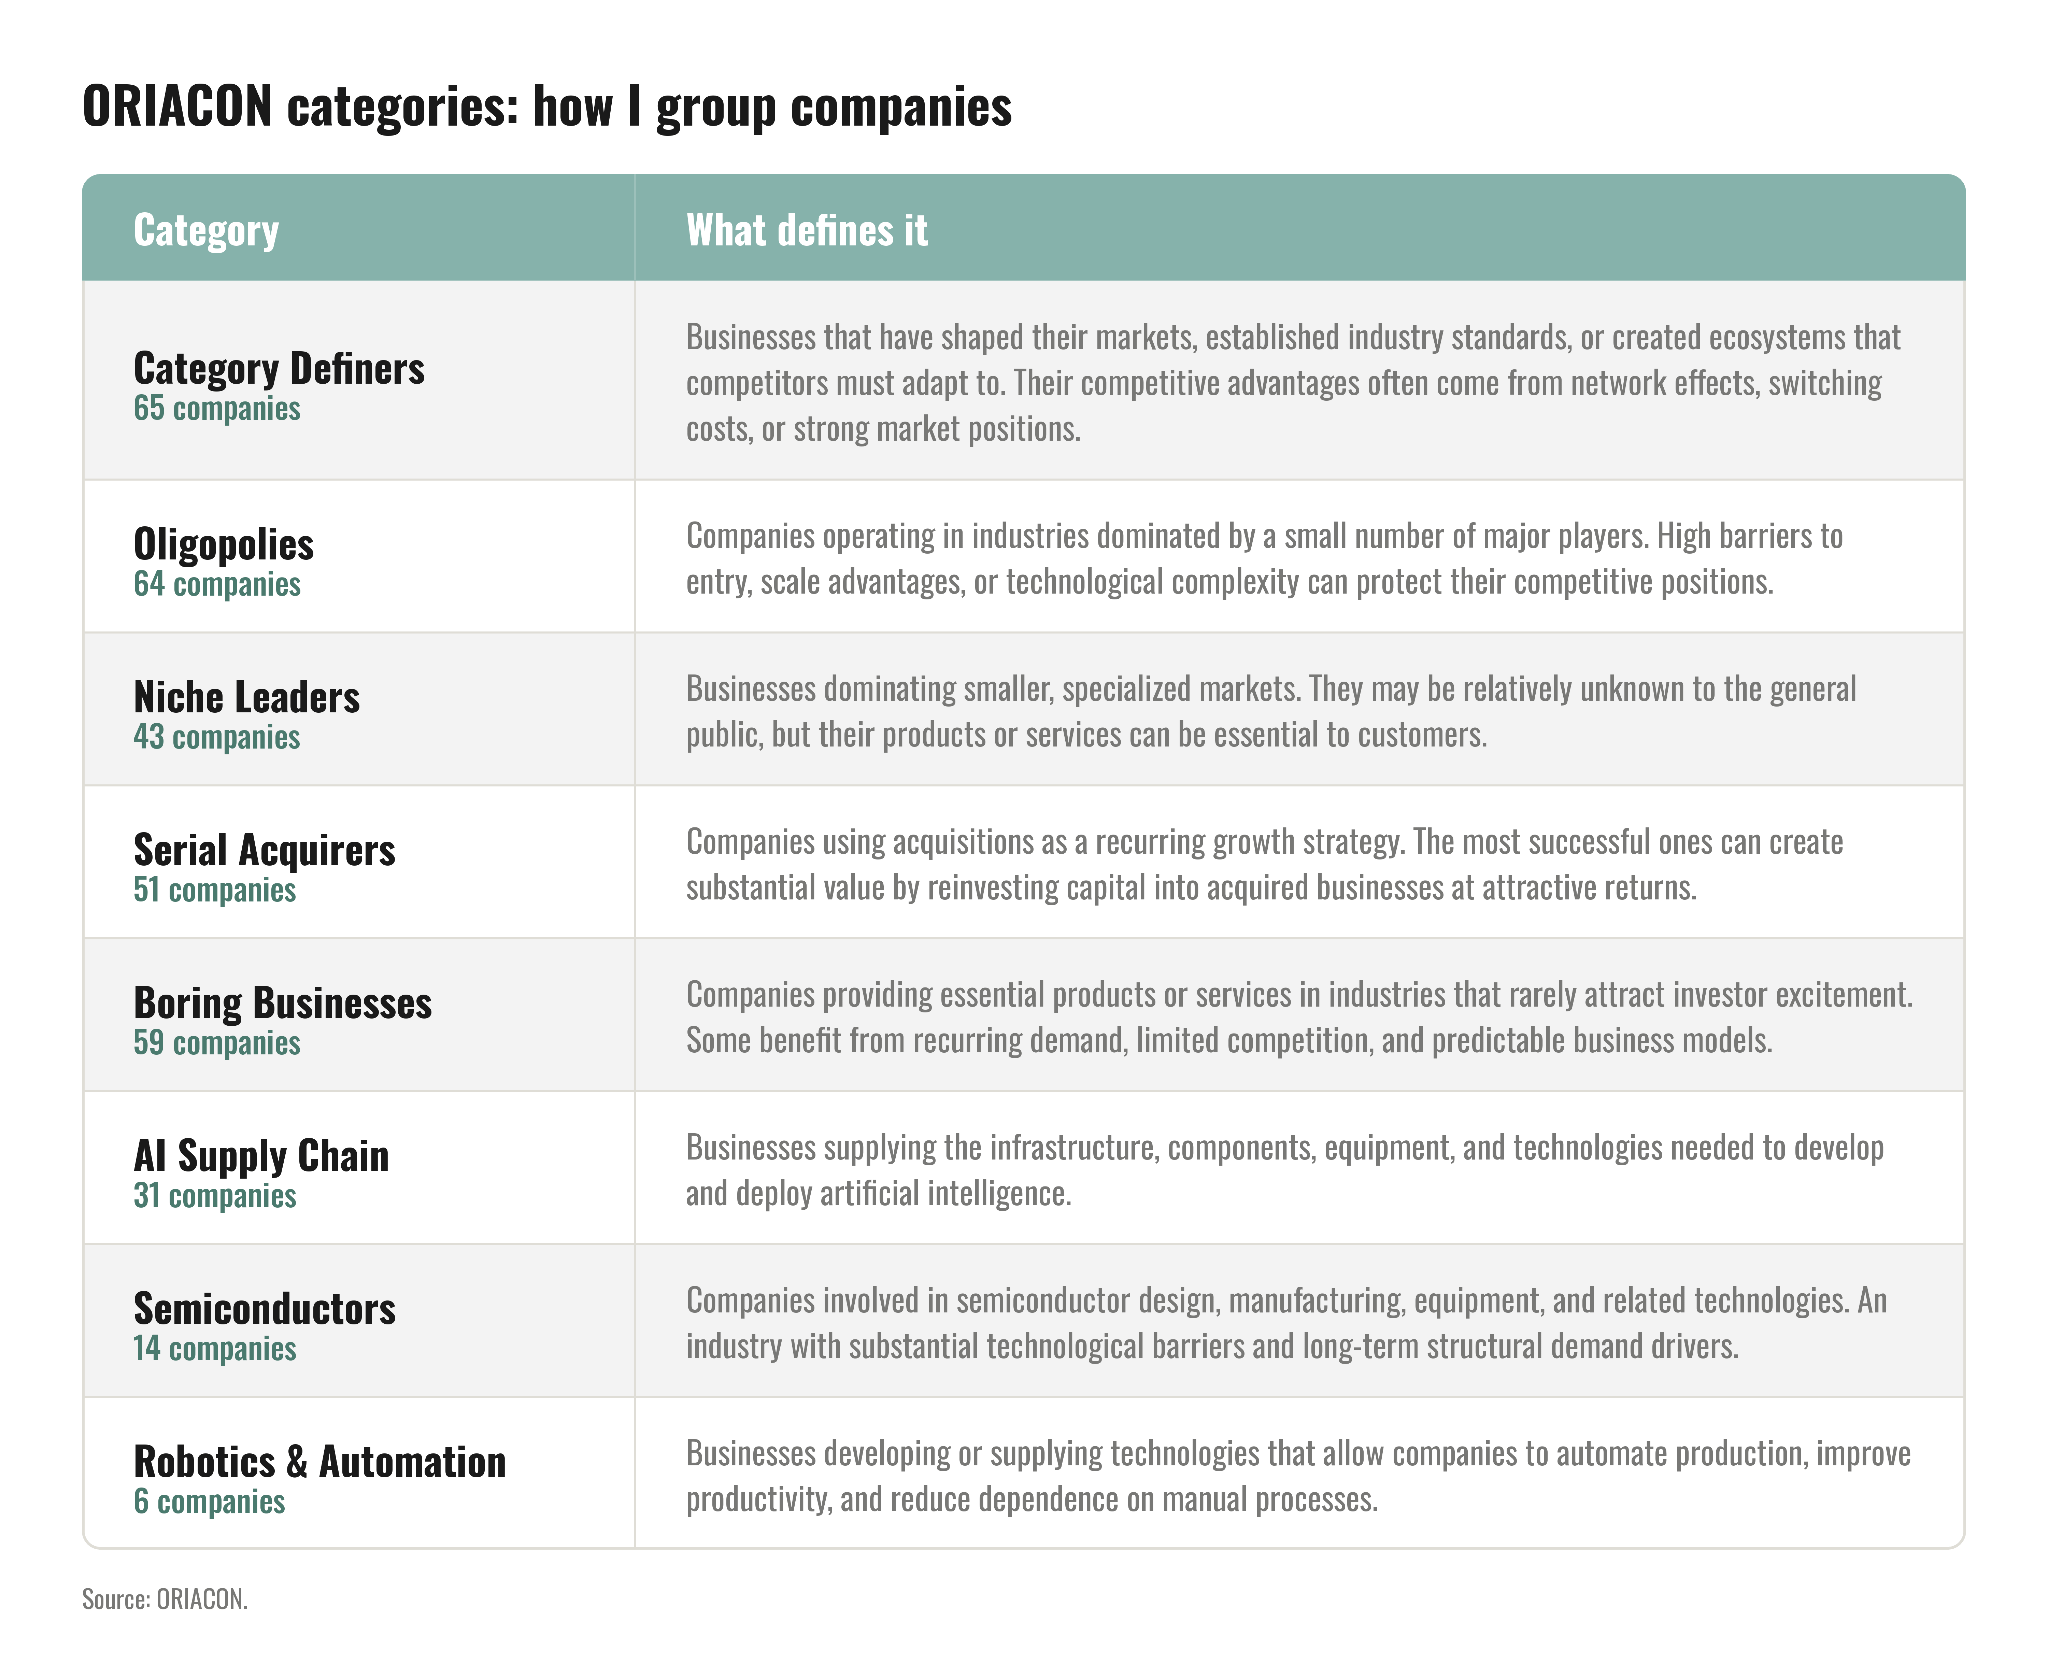
You can filter by any of these themes, or combine several to narrow your search.
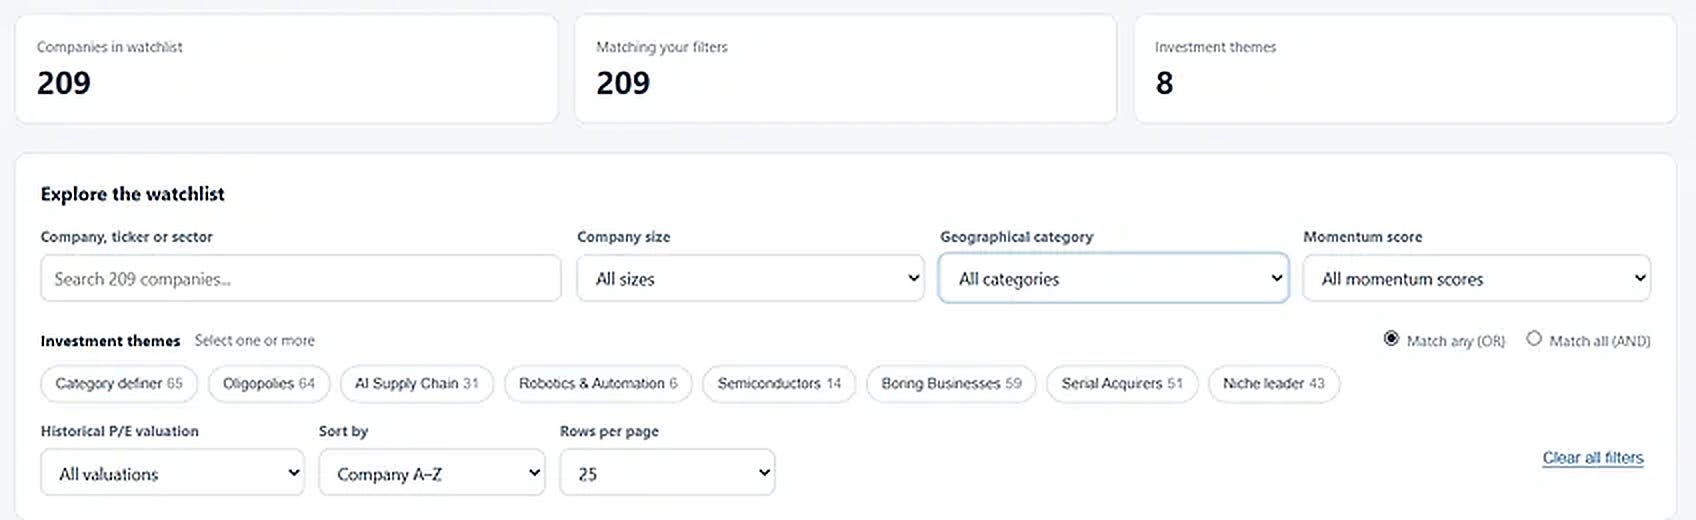
The idea is to make discovering interesting businesses easier, without limiting yourself to the same well-known stocks.
Share prices and current P/E ratios are updated through Google Finance.
Of course, the watchlist doesn’t include every successful business.
I’ve deliberately excluded some well-known companies because I’m not convinced by their long-term prospects or competitive advantages.
For example, Visa and Mastercard are absent for reasons I discussed in a previous article.
I won’t go through every exclusion here, but the idea is simple: a company’s past success doesn’t automatically make it an attractive investment for the future.
The watchlist reflects my own research and convictions, and I’ll continue refining it as businesses and industries evolve.
2. Finding the right price: what Microsoft taught me
Finding a great business is only half the job. The price you pay matters just as much.
For each company, I’ve checked the lowest and highest P/E ratios over the past 10 years.
A visual ruler shows where the current P/E stands between these two historical extremes.
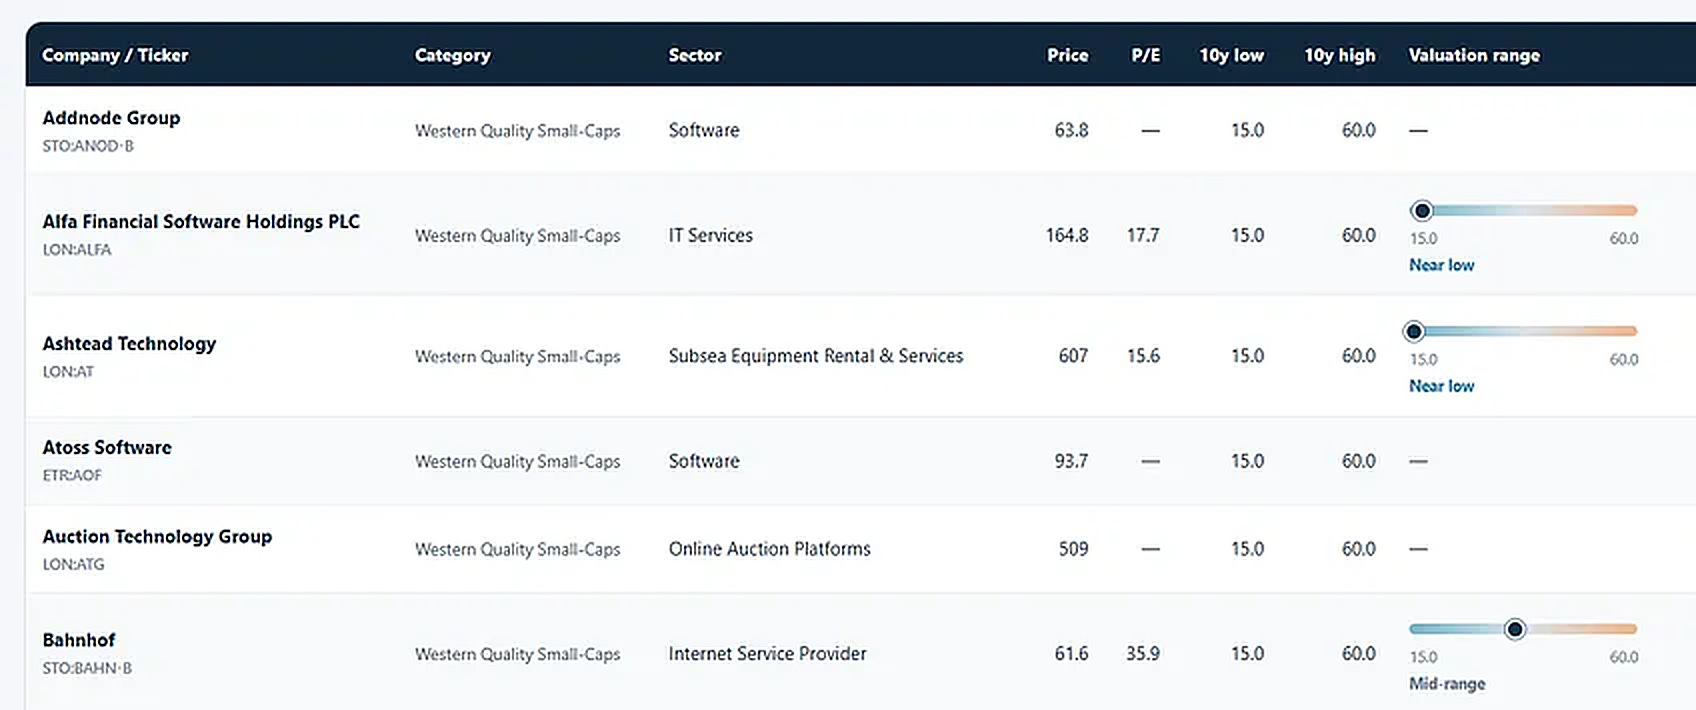
This makes it possible to scan hundreds of companies and quickly spot those trading near their historical valuation lows or highs.
Let’s look at a few examples:
The table shows Automatic Data Processing trading closer to its 10-year P/E low than its high, while Booking is below its historical low (shown in green). Bentley Systems is toward the upper end of its range, and Bloom Energy is above its previous 10-year P/E high.
With this simple visual comparison, you can quickly identify companies whose valuations deserve a closer look.
Here’s how I used this information in practice.
In June 2026, I noticed that Microsoft was trading near the bottom of its historical valuation range.
That observation prompted me to investigate further, leading to my Microsoft deep dive, published on June 30, 2026.
Since then, my position has gained 46% (as of November 5, 2026).
Of course, a company trading near its historical P/E low isn’t necessarily undervalued. Its prospects may have weakened, or its earnings may temporarily distort the ratio.
But that’s precisely the point.
The watchlist doesn’t tell me what to buy. It helps me identify what deserves further research.
3. Momentum: avoiding falling knives and FOMO
Valuation isn’t the only factor I monitor, because a company can look historically cheap and continue falling for months. Conversely, a stock that has already risen substantially can attract investors who fear missing out.
That’s why I’ve also included a momentum indicator.
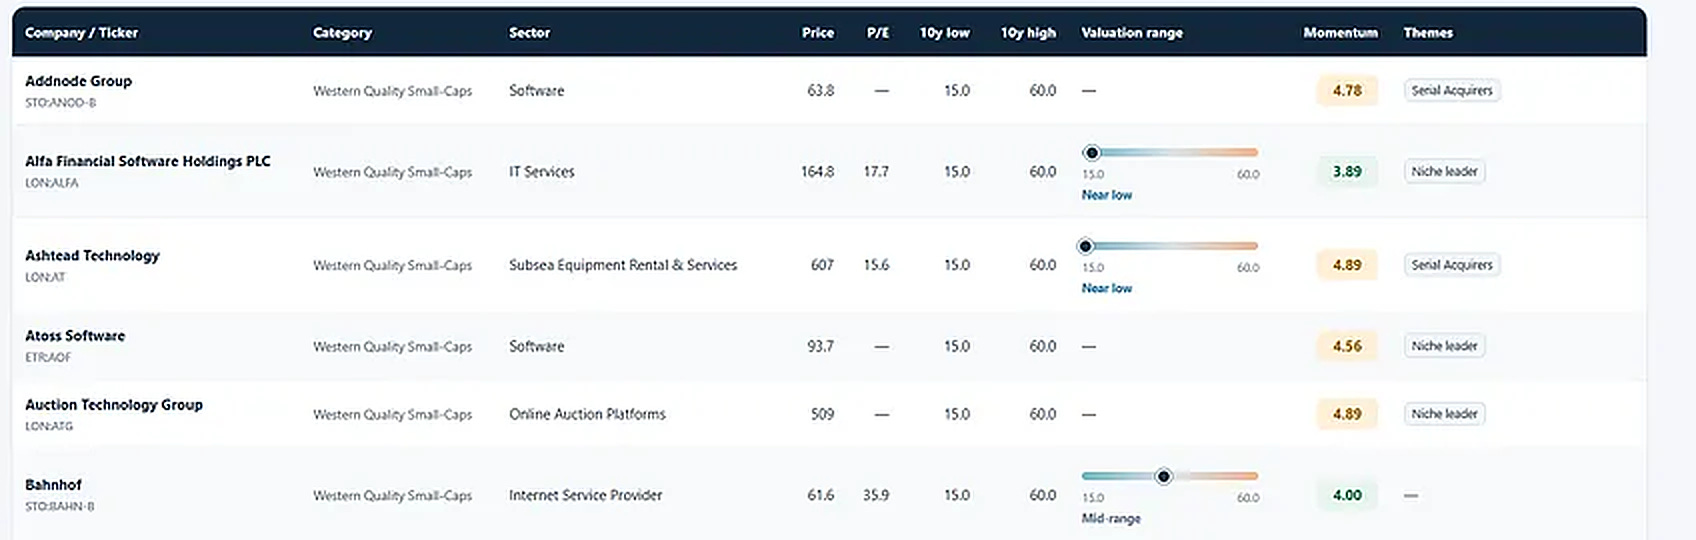
It compares each company’s share-price performance with the S&P 500 over 7, 30, 90, and 180 days, producing a score between 1 and 5.
Below 2: Weak relative momentum. The stock has significantly underperformed the S&P 500. This can be a warning sign and calls for further research before trying to catch a falling knife.
Above 4: Strong relative momentum. The stock has significantly outperformed the market. This is a reminder to check whether enthusiasm has pushed its valuation too far.
Between 2 and 4: My preferred momentum range. It helps me avoid the extremes of relative underperformance and outperformance when looking for potential entry points.
The aim isn’t to predict short-term price movements or mechanically time the market.
It’s to introduce another layer of discipline into the investment process.
Historical valuation helps identify potentially attractive prices. Momentum helps put recent market behavior into perspective.
Together, they help me prioritize which companies to investigate next.
4. How to access the watchlist
The watchlist is available to all my subscribers, including free subscribers.
You don’t need a paid subscription to access it.
Simply subscribe to ORIACON for free.